Under Armour 2014 Annual Report Download
Download and view the complete annual report
Please find the complete 2014 Under Armour annual report below. You can navigate through the pages in the report by either clicking on the pages listed below, or by using the keyword search tool below to find specific information within the annual report.-
 1
1 -
 2
2 -
 3
3 -
 4
4 -
 5
5 -
 6
6 -
 7
7 -
 8
8 -
 9
9 -
 10
10 -
 11
11 -
 12
12 -
13
-
14
-
15
-
16
-
17
-
18
-
19
-
20
-
21
-
22
-
23
-
24
-
25
-
26
-
27
-
28
-
29
-
30
-
31
-
32
-
33
-
34
-
35
-
36
-
37
-
38
-
39
-
40
-
41
-
42
-
43
-
44
-
45
-
46
-
47
-
48
-
49
-
50
-
51
-
52
-
53
-
54
-
55
-
56
-
57
-
58
-
59
-
60
-
61
-
62
-
63
-
64
-
65
-
66
-
67
-
68
-
69
-
70
-
71
-
72
-
73
-
74
-
75
-
76
-
77
-
78
-
79
-
80
-
81
-
82
-
83
-
84
-
85
-
86
-
87
-
88
-
89
-
90
-
91
-
92
-
93
-
94
-
95
-
96
-
97
-
98
-
99
-
100
-
101
-
102
-
103
-
104
 |
 |

TWO THOUSAND FOURTEEN
Table of contents
-
Page 1
TWO THOUSAND FOURTEEN -
Page 2
MapMyFitness Endomondo MyFitnessPal INTRODUCING UNDER ARMOUR CONNECTED FITNESS These four connected systems will track precise data on your training and nutrition while providing you with the support and insightful guidance of the UA global health and ï¬tness community. -
Page 3
JERMAINE JONES GISELE BÃœNDCHEN ANDY MURRAY GONZALO FIERRO // COLO COLO ROGELIO CHAVEZ // CRUZ AZUL -
Page 4
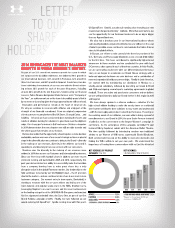
2014 SHOWCASED THE MOST BALANCED GROWTH IN UNDER ARMOUR'S HISTORY. $1,063,927 24% $1,472,684 38% $1,834,921 25% $2,332,051 27% $3,084,370 32% -
Page 5
GISELE BÃœNDCHEN MISTY COPELAND MANTEO MITCHELL STEPHEN CURRY VISITS UA SOHO STORE -
Page 6
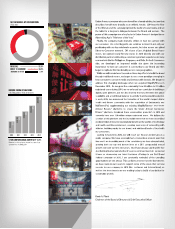
$112,355 32% $162,767 45% $208,695 28% $265,098 27% $353,955 34% SINGAPORE BEIJING SHANGHAI CHILE -
Page 7
... A Common Stock and 36,600,000 shares of Class B Convertible Common Stock outstanding. DOCUMENTS INCORPORATED BY REFERENCE Portions of Under Armour, Inc.'s Proxy Statement for the Annual Meeting of Stockholders to be held on April 29, 2015 are incorporated by reference in Part III of this Form 10... -
Page 8
[THIS PAGE INTENTIONALLY LEFT BLANK] -
Page 9
..., INC. ANNUAL REPORT ON FORM 10-K TABLE OF CONTENTS PART I. Item 1. Business General ...Products ...Marketing and Promotion ...Sales and Distribution ...Seasonality ...Product Design and Development ...Sourcing, Manufacturing and Quality Assurance ...Inventory Management ...Intellectual Property... -
Page 10
[THIS PAGE INTENTIONALLY LEFT BLANK] -
Page 11
...our global wholesale and direct to consumer channels. We plan to engage and grow this community by developing innovative applications, services and other digital solutions to impact how athletes and fitness-minded individuals train, perform and live. We were incorporated as a Maryland corporation in... -
Page 12
... the same level of performance as our other products. License and Other We have agreements with our licensees to develop Under Armour apparel and accessories. Our product, marketing and sales teams are actively involved in all steps of the design process in order to maintain brand standards and... -
Page 13
... our products, including flooring, lighting, walls, displays and images. Sales and Distribution The majority of our sales are generated through wholesale channels, which include national and regional sporting goods chains, independent and specialty retailers, department store chains, institutional... -
Page 14
...long-lived assets were located in the United States. Our largest customer, Dick's Sporting Goods, accounted for 14.4% of our net revenues in 2014. No other customers accounted for more than 10% of our net revenues. Our direct to consumer sales are generated through our brand and factory house stores... -
Page 15
... specialty stores and professional sports teams, and through Dome-owned retail stores. We hold a cost-based minority investment in Dome Corporation. Latin America We sell our products in Chile, Mexico and Brazil through wholesale distributors, website operations and two brand and six factory house... -
Page 16
... sales of our existing product offerings through our global wholesale and direct to consumer channels. We plan to engage and grow this community by developing innovative applications, services and other digital solutions to impact how athletes and fitness-minded individuals train, perform and live... -
Page 17
..., Special Make-Up Shop located at one of our distribution facilities in Maryland. Inventory Management Inventory management is important to the financial condition and operating results of our business. We manage our inventory levels based on existing orders, anticipated sales and the rapid-delivery... -
Page 18
... that can be influenced by many factors, including advertising, media, product sponsorships, product improvements and changing styles. Employees As of December 31, 2014, we had approximately 10,700 employees, including approximately 7,000 in our brand and factory house stores and 1,260 at our... -
Page 19
...changes in general economic or market conditions that could affect consumer spending and the financial health of our retail customers; our ability to effectively manage our growth and a more complex global business; our ability to successfully manage or realize expected results from acquisitions and... -
Page 20
... of a global business and as a result our brand image, net revenues and profitability may decline. We have expanded our operations rapidly since our inception and our net revenues have increased to $3,084.4 million in 2014 from $1,063.9 million in 2010. If our operations continue to grow at a rapid... -
Page 21
... in hiring, training and managing an increasing number of employees. In addition, as our business becomes more complex through the introduction of more new products and the expansion of our distribution channels, including additional brand and factory house stores and expanded distribution in malls... -
Page 22
...or interrupt production and distribution of product and raw materials. Inventory levels in excess of customer demand may result in inventory write-downs or write-offs and the sale of excess inventory at discounted prices, which could impair our brand image and have an adverse effect on gross margin... -
Page 23
... off; devoting resources to the marketing and sale of their products, including significant advertising, media placement, partnerships and product endorsement; adopting aggressive pricing policies; and engaging in lengthy and costly intellectual property and other disputes. In addition, while... -
Page 24
... operating experience and limited brand recognition in new markets may limit our expansion strategy and cause our business and growth to suffer. Our future growth depends in part on our expansion efforts outside of the North America. During the year ended December 31, 2014, 91% of our net revenues... -
Page 25
...and suppliers are located. • • • These risks could negatively affect the ability of our manufacturers to produce or deliver our products or procure materials, hamper our ability to sell products in international markets and increase our cost of doing business generally. In the event that one... -
Page 26
... selling season, including our higher price cold weather products, along with a larger proportion of higher margin direct to consumer sales. The majority of our net revenues were generated during the last two quarters in each of 2014, 2013 and 2012, respectively. Our quarterly results of operations... -
Page 27
...a result, our brand image, net revenues and profitability could be adversely affected. Sponsorships and designations as an official supplier may become more expensive and this could impact the value of our brand image. A key element of our marketing strategy has been to create a link in the consumer... -
Page 28
... our inventory and internal reports, and to ship products to customers and invoice them on a timely basis depends significantly on our enterprise resource planning, warehouse management, and other information systems. We also heavily rely on information systems to process financial and accounting... -
Page 29
...and Chief Executive Officer. The loss of the services of our senior management or other key employees could make it more difficult to successfully operate our business and achieve our business goals. We also may be unable to retain existing management, product creation, sales, marketing, operational... -
Page 30
... to manufacture and sell products based on certain of our fabrics and manufacturing technology at lower prices than we can. If our competitors do sell similar products to ours at lower prices, our net revenues and profitability could be materially adversely affected. Our intellectual property rights... -
Page 31
... particular proceeding, an unfavorable outcome may have an adverse impact on our business, financial condition and results of operations. In addition, any proceeding could negatively impact our reputation among our customers and our brand image. ITEM 1B. UNRESOLVED STAFF COMMENTS Not applicable. 21 -
Page 32
... as of December 31, 2014, we leased 147 brand and factory house stores located in the United States, Canada, China, Chile and Mexico with lease end dates in 2015 through 2028. We also lease additional office space for sales, quality assurance and sourcing, marketing, and administrative functions. We... -
Page 33
...Outdoor and Innovation from March 2008 to December 2010. He also held various senior management positions in Outdoor, Sourcing, Quality Assurance and Product Development from 1997 to February 2008. James H. Hardy, Jr. has been Chief Supply Chain Officer since April 2012. Prior to joining our Company... -
Page 34
... President, Global Marketing from October 2013 to November 2014, Senior Vice President, Global Brand and Sports Marketing from March 2012 to September 2013 and Senior Vice President of Sports Marketing from January 2010 to February 2012. He also held various senior management positions in Sales from... -
Page 35
... the Company's Class A and Class B common stock, which were effected in the form of a 100% common stock dividend distributed on July 9, 2012 and April 14, 2014, respectively. Stockholders' equity and all references to share and per share amounts herein and in the accompanying consolidated financial... -
Page 36
The number of securities to be issued upon exercise of outstanding options, warrants and rights issued under equity compensation plans approved by security holders includes 5.0 million restricted stock units and deferred stock units issued to employees, non-employees and directors of Under Armour; ... -
Page 37
Stock Performance Graph The stock performance graph below compares cumulative total return on Under Armour, Inc. Class A Common Stock to the cumulative total return of the S&P 500 Index and S&P 500 Apparel, Accessories and Luxury Goods Index from December 31, 2009 through December 31, 2014. The ... -
Page 38
... Financial Statements, including the notes thereto, and "Management's Discussion and Analysis of Financial Condition and Results of Operations" included elsewhere in this Form 10-K. (In thousands, except per share amounts) 2014 2013 Year Ended December 31, 2012 2011 2010 Net revenues Cost of goods... -
Page 39
... increased sales of our apparel, footwear and accessories, expansion of our wholesale distribution sales channel, growth in our direct to consumer sales channel and expansion in international markets. Our direct to consumer sales channel includes our brand and factory house stores and websites. New... -
Page 40
... of costs relating to sales through our wholesale channel, commissions paid to third parties and the majority of our direct to consumer sales channel costs, including the cost of brand and factory house store leases. Product innovation and supply chain costs include development and innovation costs... -
Page 41
... forth key components of our results of operations for the periods indicated, both in dollars and as a percentage of net revenues: (In thousands) 2014 Year Ended December 31, 2013 2012 Net revenues Cost of goods sold Gross profit Selling, general and administrative expenses Income from operations... -
Page 42
... continued expansion of our direct to consumer distribution channel, including increased investment in our factory house and brand house store strategies. As a percentage of net revenues, selling costs increased to 10.4% in 2014 from 10.3% in 2013. Product innovation and supply chain costs increased... -
Page 43
... of foreign taxable income in 2014 and state tax credits received in 2013. Year Ended December 31, 2013 Compared to Year Ended December 31, 2012 Net revenues increased $497.2 million, or 27.1%, to $2,332.1 million in 2013 from $1,834.9 million in 2012. Net revenues by product category are summarized... -
Page 44
... the continued expansion of our direct to consumer distribution channel. As a percentage of net revenues, selling costs increased to 10.3% in 2013 from 9.6% in 2012. Product innovation and supply chain costs increased $50.7 million to $209.2 million in 2013 from $158.5 million in 2012 primarily due... -
Page 45
... operating segment of $13.1 million. Year Ended December 31, 2013 Compared to Year Ended December 31, 2012 Net revenues by segment are summarized below: (In thousands) 2013 Year Ended December 31, 2012 $ Change % Change North America Other foreign countries and businesses Total net revenues... -
Page 46
...data below. Mar 31, 2013 Jun 30, 2013 Sep 30, 2013 Quarter Ended (unaudited) Dec 31, Mar 31, Jun 30, 2013 2014 2014 Sep 30, 2014 Dec 31, 2014 (In thousands) Net revenues Gross profit Marketing SG&A expenses Other SG&A expenses Income from operations (As a percentage of annual totals) $471,608 216... -
Page 47
..., production lead time reduction, and better planning and execution in selling of excess inventory through our factory house stores and other liquidation channels. In December 2013, we completed our acquisition of MapMyFitness. The purchase price was initially funded through $50.0 million cash on... -
Page 48
... million, partially offset by decreased net cash flows from operating assets and liabilities of $4.3 million year over year. Adjustments to net income for non-cash items increased in 2014 as compared to 2013 primarily due to higher depreciation and amortization related to acquired intangible assets... -
Page 49
...by increased capital expenditures to support international expansion and our brand and factory house strategies in the current year. Cash used in investing activities increased $191.2 million to $238.1 million in 2013 from $46.9 million in 2012. This increase in cash used in investing activities was... -
Page 50
... and $11.9 million, respectively. Currently, advances under these agreements bear interest rates which are fixed at the time of each advance. The weighted average interest rates on outstanding borrowings were 3.1%, 3.3% and 3.7% for the years ended December 31, 2014, 2013 and 2012, respectively. In... -
Page 51
...selling, general and administrative expenses on the consolidated statements of income. The operating results for this acquisition will be included in our consolidated statements of income from the date of acquisition. We are currently in the process of assessing the fair value of the assets acquired... -
Page 52
...expense was $11.0 million for the year ended December 31, 2014. (3) We generally place orders with our manufacturers at least three to four months in advance of expected future sales. The amounts listed for product purchase obligations primarily represent our open production purchase orders with our... -
Page 53
...imposed on our revenues from product sales are presented on a net basis on the consolidated statements of income and therefore do not impact net revenues or costs of goods sold. We record reductions to revenue for estimated customer returns, allowances, markdowns and discounts. We base our estimates... -
Page 54
... Statements for a further discussion on stock-based compensation. Recently Issued Accounting Standards In May 2014, the Financial Accounting Standards Board ("FASB") issued an Accounting Standards Update which supersedes the most current revenue recognition requirements. The new revenue recognition... -
Page 55
... net revenues in the United States, and the reporting currency for our consolidated financial statements is the U.S. dollar. As our net revenues and expenses generated outside of the United States increase, our results of operations could be adversely impacted by changes in foreign currency exchange... -
Page 56
... exposure. During the year ended December 31, 2014, we reclassified $0.4 million from other comprehensive income to cost of goods sold related to foreign currency forward contracts designated as cash flow hedges. The fair values of the Company's foreign currency forward contracts were assets of $806... -
Page 57
... on our financial position or results of operations in recent periods, a high rate of inflation in the future may have an adverse effect on our ability to maintain current levels of gross margin and selling, general and administrative expenses as a percentage of net revenues if the selling prices of... -
Page 58
... LLP, an independent registered public accounting firm, as stated in their report which appears herein. /S/ KEVIN A. PLANK Kevin A. Plank Chairman of the Board of Directors and Chief Executive Officer Chief Financial Officer /S/ BRAD DICKERSON Brad Dickerson Dated: February 20, 2015 48 -
Page 59
... the financial position of Under Armour, Inc. and its subsidiaries (the "Company") at December 31, 2014 and December 31, 2013, and the results of their operations and their cash flows for each of the three years in the period ended December 31, 2014 in conformity with accounting principles generally... -
Page 60
... and cash equivalents Accounts receivable, net Inventories Prepaid expenses and other current assets Deferred income taxes Total current assets Property and equipment, net Goodwill Intangible assets, net Deferred income taxes Other long term assets Total assets Liabilities and Stockholders' Equity... -
Page 61
...) 2014 Year Ended December 31, 2013 2012 Net revenues Cost of goods sold Gross profit Selling, general and administrative expenses Income from operations Interest expense, net Other expense, net Income before income taxes Provision for income taxes Net income Net income available per common share... -
Page 62
Under Armour, Inc. and Subsidiaries Consolidated Statements of Comprehensive Income (In thousands) Year Ended December 31, 2014 2013 2012 Net income Other comprehensive income (loss): Foreign currency translation adjustment Unrealized gain (loss) on cash flow hedge, net of tax of ($408), $505 and $... -
Page 63
... Stockholders' Shares Amount Shares Amount Capital Earnings Income (Loss) Equity Balance as of December 31, 2011 Exercise of stock options Shares withheld in consideration of employee tax obligations relative to stock-based compensation arrangements Issuance of Class A Common Stock, net... -
Page 64
...Year Ended December 31, 2014 2013 2012 Cash flows from operating activities Net income Adjustments to reconcile net income to net cash used in operating activities Depreciation and amortization Unrealized foreign currency exchange rate losses (gains) Loss on disposal of property and equipment Stock... -
Page 65
... Consolidated Financial Statements 1. Description of the Business Under Armour, Inc. is a developer, marketer and distributor of branded performance apparel, footwear and accessories. These products are sold worldwide and worn by athletes at all levels, from youth to professional on playing fields... -
Page 66
... at cost, including the cost of internal labor for software customized for internal use, less accumulated depreciation and amortization. Property and equipment is depreciated using the straight-line method over the estimated useful lives of the assets: 3 to 10 years for furniture, office equipment... -
Page 67
... fair values at the date of acquisition and are allocated to the reporting units that are expected to receive the related benefits. Goodwill and indefinite lived intangible assets are not amortized and are required to be tested for impairment at least annually or sooner whenever events or changes in... -
Page 68
...'s revenues from product sales are presented on a net basis on the consolidated statements of income and therefore do not impact net revenues or costs of goods sold. The Company records reductions to revenue for estimated customer returns, allowances, markdowns and discounts. The Company bases its... -
Page 69
... million and $34.8 million for the years ended December 31, 2014, 2013 and 2012, respectively. The Company includes outbound freight costs associated with shipping goods to customers as a component of cost of goods sold. Minority Investment The Company holds a minority investment in Dome Corporation... -
Page 70
... the consolidated financial statements and the reported amounts of revenues and expenses during the reporting period. Actual results could differ from these estimates. Fair Value of Financial Instruments The carrying amounts shown for the Company's cash and cash equivalents, accounts receivable and... -
Page 71
...accounted for as a business combination. The Company allocated the total purchase price to the tangible and intangible assets acquired and liabilities assumed based on their estimated fair values on the acquisition date, with the remaining unallocated purchase price recorded as goodwill. As a result... -
Page 72
... related to property and equipment was $63.6 million, $48.3 million and $39.8 million for the years ended December 31, 2014, 2013 and 2012, respectively. 5. Goodwill and Intangible Assets, Net The following table summarizes changes in the carrying amount of the Company's goodwill by reportable... -
Page 73
...,412 At December 31, 2014, 2013 and 2012, the Company determined that its goodwill and indefinite-lived intangible assets were not impaired. 6. Credit Facility and Long Term Debt Credit Facility In May 2014, the Company entered into a new unsecured $650.0 million credit facility and terminated its... -
Page 74
..., net was $5.3 million, $2.9 million and $5.2 million for the years ended December 31, 2014, 2013 and 2012, respectively. Interest expense includes the amortization of deferred financing costs and interest expense under the credit and long term debt facilities. The Company monitors the financial... -
Page 75
... to the sponsorships depends on many factors including general playing conditions, the number of sporting events in which they participate and the Company's decisions regarding product and marketing initiatives. In addition, the costs to design, develop, source and purchase the products furnished to... -
Page 76
... material to its consolidated financial position or results of operations. 8. Stockholders' Equity The Company's Class A Common Stock and Class B Convertible Common Stock have an authorized number of shares at December 31, 2014 of 400.0 million shares and 36.6 million shares, respectively, and each... -
Page 77
...31, 2014 and 2013. The fair value of the Company's long term debt was estimated based upon quoted prices for similar instruments (Level 2 input). 10. Provision for Income Taxes Income before income taxes is as follows: (In thousands) Year Ended December 31, 2014 2013 2012 Income before income taxes... -
Page 78
... (12,973) $ 74,661 A reconciliation from the U.S. statutory federal income tax rate to the effective income tax rate is as follows: Year Ended December 31, 2014 2013 2012 U.S. federal statutory income tax rate State taxes, net of federal tax impact Unrecognized tax benefits Nondeductible expenses... -
Page 79
... 382 of the Internal Revenue Code, and, as a result, such NOLs are subject to an annual limitation. As of December 31, 2014, the Company had $4.7 million in deferred tax assets associated with approximately $23.1 million in federal and state net operating losses from the acquisition of MapMyFitness... -
Page 80
... statements of income. The Company files income tax returns in the U.S. federal jurisdiction and various state and foreign jurisdictions. The Company is currently under audit by the Internal Revenue Service for the 2011 tax year and by the Canada Revenue Authority for the 2011 through 2012 tax years... -
Page 81
... shares of common stock were outstanding for the years ended December 31, 2014, 2013 and 2012, respectively, but were excluded from the computation of diluted earnings per share because their effect would be anti-dilutive. 12. Stock-Based Compensation Stock Compensation Plans The Under Armour... -
Page 82
... A Common Stock with the shares delivered six months following the termination of the director's service. Stock Options The weighted average fair value of a stock option granted for the year ended December 31, 2013 was $12.91. The fair value of each stock option granted is estimated on the date of... -
Page 83
... key employees under the 2005 Plan during the years ended December 31, 2014, 2013 and 2012, respectively. These performance-based restricted stock units have a weighted average fair value of $30.30 and have vesting that is tied to the achievement of certain combined annual operating income targets... -
Page 84
... and $2.3 million for the years ended December 31, 2014, 2013 and 2012, respectively. Shares of the Company's Class A Common Stock are not an investment option in this plan. In addition, the Company offers the Under Armour, Inc. Deferred Compensation Plan which allows a select group of management or... -
Page 85
.... During the year ended December 31, 2014, the Company reclassified $0.4 million from other comprehensive income to cost of goods sold related to foreign currency forward contracts designated as cash flow hedges. The fair values of the Company's foreign currency forward contracts were assets of $806... -
Page 86
... Asia-Pacific. Each geographic segment operates exclusively in one industry: the development, marketing and distribution of branded performance apparel, footwear and accessories. The CODM also receives discrete financial information for the Company's MapMyFitness business. Due to the insignificance... -
Page 87
... 2014 and 2013, the majority of the Company's long-lived assets were located in the United States. Net revenues in the United States were $2,670.4 million, $2,082.5 million and $1,650.4 million for the years ended December 31, 2014, 2013 and 2012, respectively. 17. Unaudited Quarterly Financial Data... -
Page 88
...$0.8 million during the year ended December 31, 2014. These expenses were included in selling, general and administrative expenses on the consolidated statements of income. The operating results for this acquisition will be included in the Company's consolidated statements of income from the date of... -
Page 89
... in ensuring that information required to be disclosed in our Exchange Act reports is (1) recorded, processed, summarized and reported in a timely manner and (2) accumulated and communicated to our management, including our Chief Executive Officer and Chief Financial Officer, as appropriate to... -
Page 90
... Purchases of Equity Securities." ITEM 13. CERTAIN RELATIONSHIPS AND RELATED TRANSACTIONS, AND DIRECTOR INDEPENDENCE The information required by this Item is incorporated by reference herein from the 2015 Proxy Statement under the heading "TRANSACTIONS WITH RELATED PERSONS" and "CORPORATE GOVERNANCE... -
Page 91
... of this Form 10-K: 1. Financial Statements: Report of Independent Registered Public Accounting Firm Consolidated Balance Sheets as of December 31, 2014 and 2013 Consolidated Statements of Income for the Years Ended December 31, 2014, 2013 and 2012 Consolidated Statements of Comprehensive Income for... -
Page 92
... Exhibit 2.1 of the Company's Current Report on Form 8-K filed November 14, 2013). Agreement and Plan of Merger, dated as of February 3, 2015, among Under Armour, Inc., Marathon Merger Sub, Inc., MyFitnessPal, Inc. and Fortis Advisors LLC. Articles of Amendment (incorporated by reference to Exhibit... -
Page 93
... Company's 2012 Form 10-K).* Under Armour, Inc. 2015 Non-Employee Director Compensation Plan (filed herewith), Form of Initial Restricted Stock Unit Grant (incorporated by reference to Exhibit 10.1 of the Current Report on Form 8-K filed June 6, 2006), Form of Annual Stock Option Award (incorporated... -
Page 94
... duly authorized. UNDER ARMOUR, INC. By: /s/ KEVIN A. PLANK Kevin A. Plank Chairman of the Board of Directors and Chief Executive Officer Dated: February 20, 2015 Pursuant to the requirements of the Securities Act of 1934, this report has been signed below by the following persons on behalf of the... -
Page 95
/s/ HARVEY L. SANDERS Harvey L. Sanders THOMAS J. SIPPEL Thomas J. Sippel Director /s/ Director Dated: February 20, 2015 85 -
Page 96
...to Costs and Expenses Write-Offs Net of Recoveries Balance at End of Year Description Allowance for doubtful accounts For the year ended December 31, 2014 For the year ended December 31, 2013 For the year ended December 31, 2012 Sales returns and allowances For the year ended December 31, 2014 For... -
Page 97
[THIS PAGE INTENTIONALLY LEFT BLANK] -
Page 98
[THIS PAGE INTENTIONALLY LEFT BLANK] -
Page 99
WE HAVE ALWAYS -
Page 100
THE CURRY ONE STEPHEN CURRY JAMIE FOXX, STEPHEN CURRY, KEVIN PLANK LAUNCHED THE CURRY ONE SIGNATURE SHOE TO A PACKED HOUSE AT THE MARQUEE IN NEW YORK CITY DURING NBA ALL STAR WEEKEND. -
Page 101
UA.COM -
Page 102
UA SPEEDFORM ® GEMINI UA HIGHLIGHT CLEATS UA SPEEDFORM ® STUDIOLUX™ -
Page 103
UA FOOTWEAR INNOVATION -
Page 104
TOM BRADY FOUR-TIME SUPER BOWL CHAMPION LINDSEY VONN MOST WINS IN ALPINE SKIING HISTORY (65) BUSTER POSEY THREE-TIME WORLD CHAMPION OFFICIAL PERFORMANCE FOOTWEAR SUPPLIER OF MLB CLAYTON KERSHAW (2014 STATS: 21-3, 1.77 ERA, 239K'S) STEPHEN CURRY LEADING VOTE GETTER FOR 2015 ALL-STAR GAME