Ubisoft 2013 Annual Report Download - page 9
Download and view the complete annual report
Please find page 9 of the 2013 Ubisoft annual report below. You can navigate through the pages in the report by either clicking on the pages listed below, or by using the keyword search tool below to find specific information within the annual report.-
 1
1 -
 2
2 -
 3
3 -
 4
4 -
 5
5 -
 6
6 -
 7
7 -
 8
8 -
 9
9 -
 10
10 -
 11
11 -
 12
12 -
 13
13 -
 14
14 -
 15
15 -
 16
16 -
 17
17 -
 18
18 -
 19
19 -
 20
20 -
21
-
22
-
23
-
24
-
25
-
26
-
27
-
28
-
29
-
30
-
31
-
32
-
33
-
34
-
35
-
36
-
37
-
38
-
39
-
40
-
41
-
42
-
43
-
44
-
45
-
46
-
47
-
48
-
49
-
50
-
51
-
52
-
53
-
54
-
55
-
56
-
57
-
58
-
59
-
60
-
61
-
62
-
63
-
64
-
65
-
66
-
67
-
68
-
69
-
70
-
71
-
72
-
73
-
74
-
75
-
76
-
77
-
78
-
79
-
80
-
81
-
82
-
83
-
84
-
85
-
86
-
87
-
88
-
89
-
90
-
91
-
92
-
93
-
94
-
95
-
96
-
97
-
98
-
99
-
100
-
101
-
102
-
103
-
104
-
105
-
106
-
107
-
108
-
109
-
110
-
111
-
112
-
113
-
114
-
115
-
116
-
117
-
118
-
119
-
120
-
121
-
122
-
123
-
124
-
125
-
126
-
127
-
128
-
129
-
130
-
131
-
132
-
133
-
134
-
135
-
136
-
137
-
138
-
139
-
140
-
141
-
142
-
143
-
144
-
145
-
146
-
147
-
148
-
149
-
150
-
151
-
152
-
153
-
154
-
155
-
156
-
157
-
158
-
159
-
160
-
161
-
162
-
163
-
164
-
165
-
166
-
167
-
168
-
169
-
170
-
171
-
172
-
173
-
174
-
175
-
176
-
177
-
178
-
179
-
180
-
181
-
182
-
183
-
184
-
185
-
186
-
187
-
188
-
189
-
190
-
191
-
192
-
193
-
194
-
195
-
196
-
197
-
198
-
199
-
200
-
201
-
202
-
203
-
204
-
205
-
206
-
207
-
208
-
209
-
210
-
211
-
212
-
213
-
214
-
215
-
216
-
217
-
218
-
219
-
220
-
221
-
222
-
223
-
224
-
225
-
226
-
227
 |
 |

Management Report
2013
4
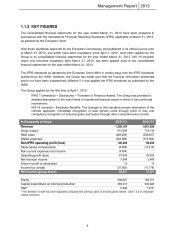
KEY FIGURES 1.1.3
The consolidated financial statements for the year ended March 31, 2013 have been prepared in
accordance with the International Financial Reporting Standards (IFRS) applicable at March 31, 2013,
as adopted by the European Union.
Only those standards approved by the European Commission and published in its official journal prior
to March 31, 2013, and which have been mandatory since April 1, 2012, have been applied by the
Group to its consolidated financial statements for the year ended March 31, 2013. IAS 19 (revised)
which only becomes mandatory after March 31, 2013, has been applied early to the consolidated
financial statements for the year ended March 31, 2013.
The IFRS standards as adopted by the European Union differ in certain ways from the IFRS standards
published by the IASB. However, the Group has made sure that the financial information presented
would not have been substantively different if it had applied the IFRS standards as published by the
IASB.
The Group applied for the first time at April 1, 2012:
- IFRS 7 (amended) – Disclosures – Transfers of Financial Assets. The Group has provided a
detailed description of the risks linked to transferred financial assets in which it has continued
involvement;
- IAS 19 (revised) – Employee Benefits. The changes to this standard concern elimination of the
corridor approach, immediate recognition of past service costs through profit or loss and
compulsory recognition of actuarial gains and losses through other comprehensive income.
In thousands of euros
03/31/13
03/31/12
Revenue
1,256,164
1,061,296
Gross margin
913,509
718,134
R&D costs
(428,226)
(348,407)
SG&A expenses
(384,988)
(313,694)
Non-IFRS operating profit (loss)
100,294
56,033
Stock based compensation
(8,098)
(10,410)
Non-current expenses and income
(4,293)
-
Operating profit (loss)
87,904
45,623
Net financial income
3,998
2,466
Share in profit of associates
12
10
Income tax (credit)
(27,083)
(10,778)
Net income (group share)
64,831
37,321
Equity
838,227
762,707
Capital expenditure on internal production
383,015
333,923
Staff
8,268
7,275*
* The definition of staff has been expanded compared with previous years to include games testers. (See 1.4.2 on employee-
related indicators)