TomTom 2013 Annual Report Download - page 78
Download and view the complete annual report
Please find page 78 of the 2013 TomTom annual report below. You can navigate through the pages in the report by either clicking on the pages listed below, or by using the keyword search tool below to find specific information within the annual report.-
 1
1 -
2
-
3
-
4
-
5
-
6
-
7
-
8
-
9
-
10
-
11
-
12
-
13
-
14
-
15
-
16
-
17
-
18
-
19
-
20
-
21
-
22
-
23
-
24
-
25
-
26
-
27
-
28
-
29
-
30
-
31
-
32
-
33
-
34
-
35
-
36
-
37
-
38
-
39
-
40
-
41
-
42
-
43
-
44
-
45
-
46
-
47
-
48
-
49
-
50
-
51
-
52
-
53
-
54
-
55
-
56
-
57
-
58
-
59
-
60
-
61
-
62
-
63
-
64
-
65
-
66
-
67
-
 68
68 -
 69
69 -
 70
70 -
 71
71 -
 72
72 -
 73
73 -
 74
74 -
 75
75 -
 76
76 -
 77
77 -
 78
78 -
 79
79 -
 80
80 -
 81
81 -
 82
82 -
 83
83 -
 84
84 -
 85
85 -
 86
86 -
 87
87 -
 88
88 -
89
-
90
-
91
-
92
-
93
 |
 |

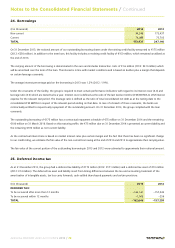
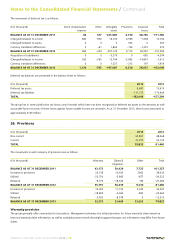
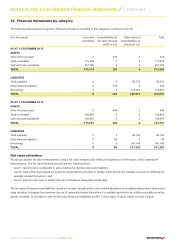
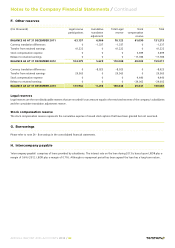
33. Financial instruments by category
The following table presents the group's financial instruments according to the categories as defined in IAS 39:
(€ in thousands) Loans and
receivables
Assets/liabilities at
fair value through
profit or loss
Other financial
assets/liabilities at
amortised cost
Total
AS AT 31 DECEMBER 2013
ASSETS
Other financial assets 0 376 0 376
Trade receivables 115,429 0 0 115,429
Cash and cash equivalents 257,785 0 0 257,785
TOTAL 373,214 376 0 373,590
LIABILITIES
Trade payables 0 0 82,337 82,337
Other financial liabilities 0 236 0 236
Borrowings 0 0 173,437 173,437
TOTAL 0 236 255,774 256,010
AS AT 31 DECEMBER 2012
ASSETS
Other financial assets 0 444 0 444
Trade receivables 149,834 0 0 149,834
Cash and cash equivalents 164,459 0 0 164,459
TOTAL 314,293 444 0 314,737
LIABILITIES
Trade payables 0 0 84,162 84,162
Other financial liabilities 0 85 0 85
Borrowings 0 0 247,140 247,140
TOTAL 0 85 331,302 331,387
Fair value estimation
The group classifies fair value measurements using a fair value hierarchy that reflects the significance of the inputs used in making the
measurements. The fair value hierarchy should have the following levels:
• Level 1: quoted prices (unadjusted) in active markets for identical assets and liabilities;
• Level 2: inputs other than quoted prices that are observable for the asset or liability, either directly (for example, as prices) or indirectly (for
example, derived from prices); and
• Level 3: inputs for the asset or liability that are not based on observable market data.
The fair value of financial assets/liabilities carried at fair value through profit or loss and the derivatives in a hedging relationship is determined
using valuation techniques that maximise the use of observable market data where it is available and which rely as little as possible on entity-
specific estimates. In accordance with the fair value hierarchy established by IFRS 7, these types of inputs classify as Level 2 inputs.
Notes to the Consolidated Financial Statements / Continued
ANNUAL REPORT AND ACCOUNTS 2013 / 78