TomTom 2013 Annual Report Download - page 63
Download and view the complete annual report
Please find page 63 of the 2013 TomTom annual report below. You can navigate through the pages in the report by either clicking on the pages listed below, or by using the keyword search tool below to find specific information within the annual report.-
 1
1 -
2
-
3
-
4
-
5
-
6
-
7
-
8
-
9
-
10
-
11
-
12
-
13
-
14
-
15
-
16
-
17
-
18
-
19
-
20
-
21
-
22
-
23
-
24
-
25
-
26
-
27
-
28
-
29
-
30
-
31
-
32
-
33
-
34
-
35
-
36
-
37
-
38
-
39
-
40
-
41
-
42
-
43
-
44
-
45
-
46
-
47
-
48
-
49
-
50
-
51
-
52
-
 53
53 -
 54
54 -
 55
55 -
 56
56 -
 57
57 -
 58
58 -
 59
59 -
 60
60 -
 61
61 -
 62
62 -
 63
63 -
 64
64 -
 65
65 -
 66
66 -
 67
67 -
 68
68 -
 69
69 -
 70
70 -
 71
71 -
 72
72 -
 73
73 -
74
-
75
-
76
-
77
-
78
-
79
-
80
-
81
-
82
-
83
-
84
-
85
-
86
-
87
-
88
-
89
-
90
-
91
-
92
-
93
 |
 |
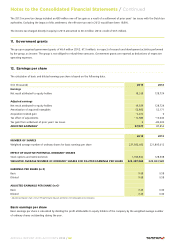
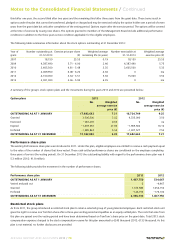
Diluted earnings per share
Diluted earnings per share is calculated by adjusting the weighted average number of ordinary shares outstanding to assume conversion of
all potential dilutive ordinary shares arising from stock options and other equity-settled share-based plans. For the stock options, a calculation
is performed to determine the number of shares that could have been acquired at fair value (determined as the average annual market share
price of the company’s shares), based on the monetary value of the subscription rights attached to outstanding share options. The number
of shares calculated as above is compared with the number of shares that would have been issued, assuming the exercise of the stock options.
When the effect of the options and other equity-settled share-based plans is anti-dilutive, the number is excluded from the calculation of
diluted earnings.
Adjusted earnings per share
Adjusted earnings per share is calculated by dividing the adjusted earnings by the weighted average number of ordinary and diluted shares
outstanding during the year.
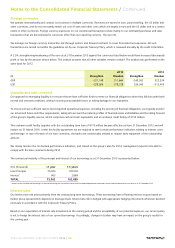
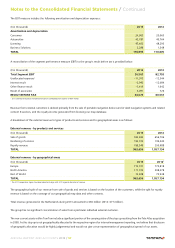
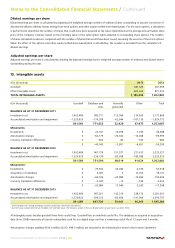
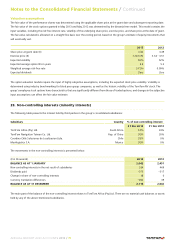
13. Intangible assets
(€ in thousands) 2013 2012
Goodwill 381,569 381,569
Other intangible assets 803,635 821,233
TOTAL INTANGIBLE ASSETS 1,185,204 1,202,802
(€ in thousands) Goodwill Database and
tools
Internally
generated
Other1Total
BALANCE AS AT 31 DECEMBER 2011
Investment cost 1,902,489 945,711 115,064 214,605 3,177,869
Accumulated amortisation and impairment –1,520,920 –174,078 –62,644 –167,130 –1,924,772
381,569 771,633 52,420 47,475 1,253,097
Movements
Investments 0 22,741 16,478 7,169 46,388
Amortisation charges 0 –62,179 –20,362 –13,458 –95,999
Currency translation differences 0 –605 83 –162 –684
0 –40,043 –3,801 –6,451 –50,295
BALANCE AS AT 31 DECEMBER 2012
Investment cost 1,902,489 967,729 131,527 221,612 3,223,357
Accumulated amortisation and impairment –1,520,920 –236,139 –82,908 –180,588 –2,020,555
381,569 731,590 48,619 41,024 1,202,802
Movements2
Investments 0 29,502 34,040 4,376 67,918
Acquisition of subsidiary 0 4,387 0 13,754 18,141
Amortisation charges 0 –64,726 –22,984 –12,694 –100,404
Currency translation differences 0 –3,047 –12 –194 –3,253
0 –33,884 11,044 5,242 –17,598
BALANCE AS AT 31 DECEMBER 2013
Investment cost 1,902,489 997,021 143,319 238,172 3,281,001
Accumulated amortisation and impairment –1,520,920 –299,315 –83,656 –191,906 –2,095,797
381,569 697,706 59,663 46,266 1,185,204
1Other intangible assets include technology, customer relationships, brand name and software.
2During the year we disposed of certain intangibles with zero book values. The total gross amount of the asset disposed across all asset classes was €23.7 million.
All intangible assets besides goodwill have finite useful lives. Goodwill has an indefinite useful life. The database as acquired at acquisition
date (June 2008) represents all stored routing data used for our digital maps and has a remaining useful life of 13 years and 5 months.
Amortisation charges totalling €100.4 million (2012: €96.0 million) are included in the following line items in the Income Statement:
Notes to the Consolidated Financial Statements / Continued
ANNUAL REPORT AND ACCOUNTS 2013 / 63