TomTom 2013 Annual Report Download - page 58
Download and view the complete annual report
Please find page 58 of the 2013 TomTom annual report below. You can navigate through the pages in the report by either clicking on the pages listed below, or by using the keyword search tool below to find specific information within the annual report.-
 1
1 -
2
-
3
-
4
-
5
-
6
-
7
-
8
-
9
-
10
-
11
-
12
-
13
-
14
-
15
-
16
-
17
-
18
-
19
-
20
-
21
-
22
-
23
-
24
-
25
-
26
-
27
-
28
-
29
-
30
-
31
-
32
-
33
-
34
-
35
-
36
-
37
-
38
-
39
-
40
-
41
-
42
-
43
-
44
-
45
-
46
-
47
-
 48
48 -
 49
49 -
 50
50 -
 51
51 -
 52
52 -
 53
53 -
 54
54 -
 55
55 -
 56
56 -
 57
57 -
 58
58 -
 59
59 -
 60
60 -
 61
61 -
 62
62 -
 63
63 -
 64
64 -
 65
65 -
 66
66 -
 67
67 -
 68
68 -
69
-
70
-
71
-
72
-
73
-
74
-
75
-
76
-
77
-
78
-
79
-
80
-
81
-
82
-
83
-
84
-
85
-
86
-
87
-
88
-
89
-
90
-
91
-
92
-
93
 |
 |

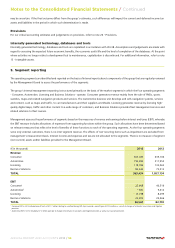
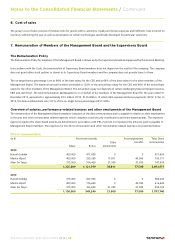
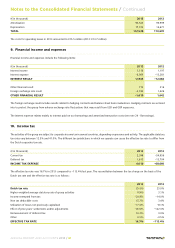
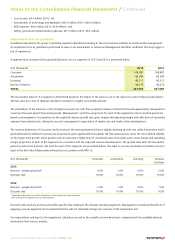
6. Cost of sales
The group's cost of sales consists of material costs for goods sold to customers, royalty and license expenses and fulfilment costs incurred on
inventory sold during the year as well as amortisation of certain technologies specifically developed for particular customers.
7. Remuneration of Members of the Management Board and the Supervisory Board
The Remuneration Policy
The Remuneration Policy for members of the Management Board is drawn up by the Supervisory Board and approved by the General Meeting.
In accordance with the Code, the remuneration of Supervisory Board members does not depend on the results of the company. The company
does not grant either stock options or shares to its Supervisory Board members and the company does not provide loans to them.
The on-target bonus percentage is set at 80% of the base salary for the CEO and at 64% of the base salary for the other members of the
Management Board. The maximum annual incentive achievable is 120% of the annual base salary for the CEO and 96% of the annual base
salary for the other members of the Management Board. The actual bonus pay-out depends on certain challenging financial targets (revenue,
EBIT and cash flow). The total remuneration paid/payable to or on behalf of the members of the Management Board for the year ended 31
December 2013, amounted to approximately €2.5 million (2012: €1.8 million), of which 46% represented bonus payments (2012: 31%). In
2013, the bonus achievement was 131% of the on-target bonus percentage (2012: 69%).
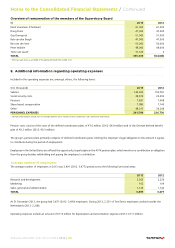
Overview of salaries, performance-related bonuses and other emoluments of the Management Board
The remuneration of the Management Board members comprises of the direct remuneration paid or payable in relation to their employment
in the year and other remuneration related expenses which comprises social security contributions and share-based awards. The expenses/
(gains) recognised for share-based awards are determined in accordance with IFRS 2 and do not represent the amounts paid or payable to
Management Board members. The expenses for the direct remuneration and other remuneration related expenses are presented below:
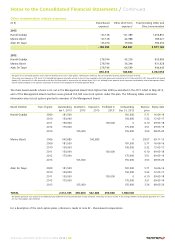
Direct remuneration
(in €) Short-term benefits Post-employment
benefits
Total Direct
remuneration
Salary Bonus
Other
emoluments
2013
Harold Goddijn 450,000 471,600 0 0 921,600
Marina Wyatt 400,000 335,360 17,811 40,000 793,171
Alain De Taeye 375,000 314,400 21,000 37,500 747,900
1,225,000 1,121,360 38,811 77,500 2,462,671
2012
Harold Goddijn 375,000 207,000 0 0 582,000
Marina Wyatt 400,000 176,640 0 40,000 616,640
Alain De Taeye 375,000 165,600 21,000 37,500 599,100
1,150,000 549,240 21,000 77,500 1,797,740
Notes to the Consolidated Financial Statements / Continued
ANNUAL REPORT AND ACCOUNTS 2013 / 58