TomTom 2013 Annual Report Download - page 61
Download and view the complete annual report
Please find page 61 of the 2013 TomTom annual report below. You can navigate through the pages in the report by either clicking on the pages listed below, or by using the keyword search tool below to find specific information within the annual report.-
 1
1 -
2
-
3
-
4
-
5
-
6
-
7
-
8
-
9
-
10
-
11
-
12
-
13
-
14
-
15
-
16
-
17
-
18
-
19
-
20
-
21
-
22
-
23
-
24
-
25
-
26
-
27
-
28
-
29
-
30
-
31
-
32
-
33
-
34
-
35
-
36
-
37
-
38
-
39
-
40
-
41
-
42
-
43
-
44
-
45
-
46
-
47
-
48
-
49
-
50
-
 51
51 -
 52
52 -
 53
53 -
 54
54 -
 55
55 -
 56
56 -
 57
57 -
 58
58 -
 59
59 -
 60
60 -
 61
61 -
 62
62 -
 63
63 -
 64
64 -
 65
65 -
 66
66 -
 67
67 -
 68
68 -
 69
69 -
 70
70 -
 71
71 -
72
-
73
-
74
-
75
-
76
-
77
-
78
-
79
-
80
-
81
-
82
-
83
-
84
-
85
-
86
-
87
-
88
-
89
-
90
-
91
-
92
-
93
 |
 |
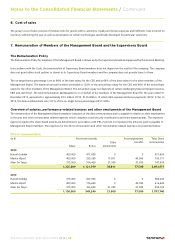
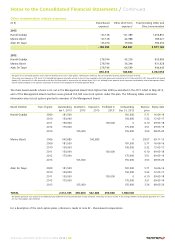
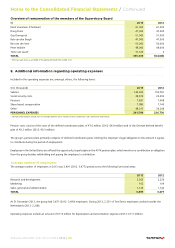
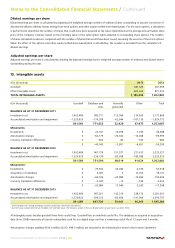
(€ in thousands) 2013 2012
Amortisation 95,523 95,999
Depreciation 17,015 14,671
TOTAL 112,538 110,670
The costs for operating leases in 2013 amounted to €15.5 million (2012: €13.7 million).
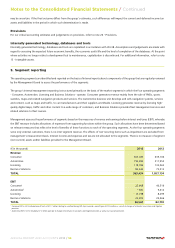
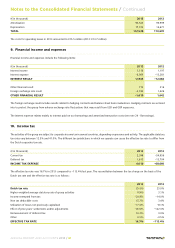
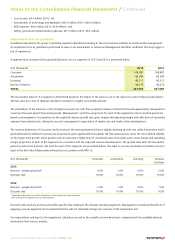
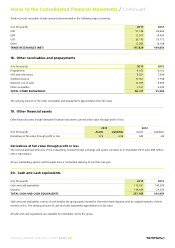
9. Financial income and expenses
Financial income and expenses include the following items:
(€ in thousands) 2013 2012
Interest income 1,114 1,197
Interest expense –4,059 –13,281
INTEREST RESULT –2,945 –12,084
Other financial result 714 216
Foreign exchange rate result –2,333 1,426
OTHER FINANCIAL RESULT –1,619 1,642
The foreign exchange result includes results related to hedging contracts and balance sheet item revaluations. Hedging contracts are entered
into to protect the group from adverse exchange rate fluctuations that may result from USD and GBP exposures.
The interest expense relates mainly to interest paid on our borrowings and amortised transaction costs (see note 24 - Borrowings).
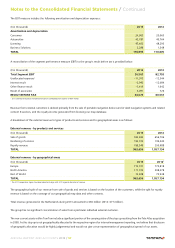
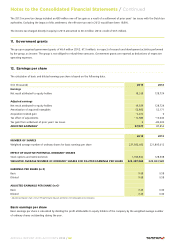
10. Income tax
The activities of the group are subject to corporate income tax in several countries, depending on presence and activity. The applicable statutory
tax rates vary between 12.5% and 41.0%. The different tax jurisdictions in which we operate can cause the effective tax rate to differ from
the Dutch corporate tax rate.
(€ in thousands) 2013 2012
Current tax 2,398 –54,956
Deferred tax 1,612 –13,704
INCOME TAX EXPENSE 4,010 –68,660
The effective tax rate was 16.7% in 2013 compared to –113.4% last year. The reconciliation between the tax charge on the basis of the
Dutch tax rate and the effective tax rate is as follows:
2013 2012
Dutch tax rate 25.0% 25.0%
Higher weighted average statutory rate of group activities 6.9% 3.1%
Income exempted from tax –20.8% –14.0%
Non tax deductible costs 15.7% 3.4%
Utilisation of losses not previously capitalised –17.3% –8.1%
Effect of prior years' settlements and/or adjustments –26.5% –122.3%
Remeasurement of deferred tax 33.2% 0.0%
Other 0.5% –0.5%
EFFECTIVE TAX RATE 16.7% –113.4%
Notes to the Consolidated Financial Statements / Continued
ANNUAL REPORT AND ACCOUNTS 2013 / 61