TomTom 2013 Annual Report Download - page 68
Download and view the complete annual report
Please find page 68 of the 2013 TomTom annual report below. You can navigate through the pages in the report by either clicking on the pages listed below, or by using the keyword search tool below to find specific information within the annual report.-
 1
1 -
2
-
3
-
4
-
5
-
6
-
7
-
8
-
9
-
10
-
11
-
12
-
13
-
14
-
15
-
16
-
17
-
18
-
19
-
20
-
21
-
22
-
23
-
24
-
25
-
26
-
27
-
28
-
29
-
30
-
31
-
32
-
33
-
34
-
35
-
36
-
37
-
38
-
39
-
40
-
41
-
42
-
43
-
44
-
45
-
46
-
47
-
48
-
49
-
50
-
51
-
52
-
53
-
54
-
55
-
56
-
57
-
 58
58 -
 59
59 -
 60
60 -
 61
61 -
 62
62 -
 63
63 -
 64
64 -
 65
65 -
 66
66 -
 67
67 -
 68
68 -
 69
69 -
 70
70 -
 71
71 -
 72
72 -
 73
73 -
 74
74 -
 75
75 -
 76
76 -
 77
77 -
 78
78 -
79
-
80
-
81
-
82
-
83
-
84
-
85
-
86
-
87
-
88
-
89
-
90
-
91
-
92
-
93
 |
 |
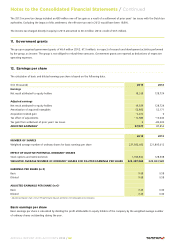
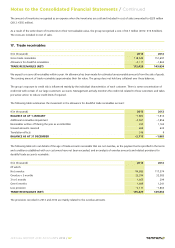
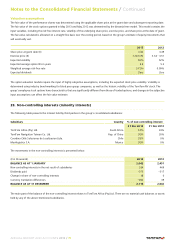
Trade accounts receivable include amounts denominated in the following major currencies:
(€ in thousands) 2013 2012
EUR 57,146 60,464
GBP 12,507 19,490
USD 33,193 53,772
Other 12,583 16,108
TRADE RECEIVABLES (NET) 115,429 149,834
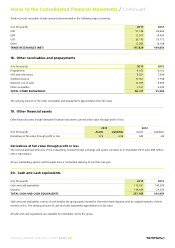
18. Other receivables and prepayments
(€ in thousands) 2013 2012
Prepayments 6,247 6,102
VAT and other taxes 6,551 7,599
Unbilled revenue 11,057 7,758
Deferred cost of sales 10,969 9,495
Other receivables 3,297 4,340
TOTAL OTHER RECEIVABLES 38,121 35,294
The carrying amount of the other receivables and prepayments approximates their fair value.
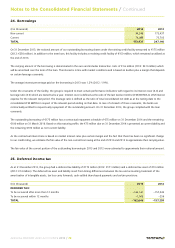
19. Other financial assets
Other financial assets include derivative financial instruments carried at fair value through profit or loss.
2013 2012
(€ in thousands) Assets Liabilities Assets Liabilities
Derivatives at fair value through profit or loss 376 –236 444 –85
Derivatives at fair value through profit or loss
The notional principal amounts of the outstanding forward foreign exchange and option contracts at 31 December 2013 were €69 million
(2012: €62 million).
All our outstanding options and forwards have a contractual maturity of less than one year.
20. Cash and cash equivalents
(€ in thousands) 2013 2012
Cash and cash equivalents 119,361 140,205
Deposits 138,424 24,254
TOTAL CASH AND CASH EQUIVALENTS 257,785 164,459
Cash and cash equivalents consist of cash held by the group partly invested in short-term bank deposits with an original maturity of three
months or less. The carrying amount of cash and cash equivalents approximates its fair value.
All cash and cash equivalents are available for immediate use by the group.
Notes to the Consolidated Financial Statements / Continued
ANNUAL REPORT AND ACCOUNTS 2013 / 68