TomTom 2013 Annual Report Download - page 57
Download and view the complete annual report
Please find page 57 of the 2013 TomTom annual report below. You can navigate through the pages in the report by either clicking on the pages listed below, or by using the keyword search tool below to find specific information within the annual report.-
 1
1 -
2
-
3
-
4
-
5
-
6
-
7
-
8
-
9
-
10
-
11
-
12
-
13
-
14
-
15
-
16
-
17
-
18
-
19
-
20
-
21
-
22
-
23
-
24
-
25
-
26
-
27
-
28
-
29
-
30
-
31
-
32
-
33
-
34
-
35
-
36
-
37
-
38
-
39
-
40
-
41
-
42
-
43
-
44
-
45
-
46
-
 47
47 -
 48
48 -
 49
49 -
 50
50 -
 51
51 -
 52
52 -
 53
53 -
 54
54 -
 55
55 -
 56
56 -
 57
57 -
 58
58 -
 59
59 -
 60
60 -
 61
61 -
 62
62 -
 63
63 -
 64
64 -
 65
65 -
 66
66 -
 67
67 -
68
-
69
-
70
-
71
-
72
-
73
-
74
-
75
-
76
-
77
-
78
-
79
-
80
-
81
-
82
-
83
-
84
-
85
-
86
-
87
-
88
-
89
-
90
-
91
-
92
-
93
 |
 |

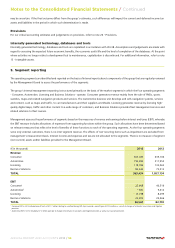
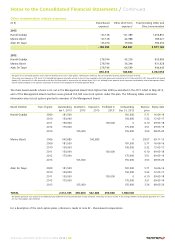
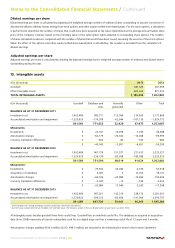
The EBIT measure includes the following amortisation and depreciation expenses:
(€ in thousands) 2013 2012
Amortisation and depreciation
Consumer 24,905 20,063
Automotive 42,187 40,764
Licensing 47,605 48,295
Business Solutions 2,298 1,548
TOTAL 116,995 110,670
A reconciliation of the segment performance measure (EBIT) to the group's result before tax is provided below.
(€ in thousands) 2013 2012
Total Segment EBIT 36,561 82,793
Unallocated expenses1–11,015 –12,544
Interest result –2,945 –12,084
Other finance result –1,619 1,642
Result of associates 3,091 726
RESULT BEFORE TAX 24,073 60,533
12013 unallocated expenses included amortisation and depreciation expense of €0.4 million.
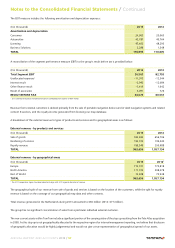
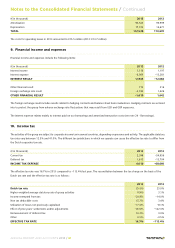
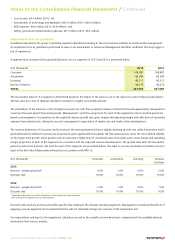
Revenue from external customers is derived primarily from the sale of portable navigation devices and in-dash navigation systems and related
content & services, and the royalty income generated from licensing our map database.
A breakdown of the external revenue to types of products and services and to geographical areas is as follows:
External revenue - by products and services
(€ in thousands) 2013 2012
Sale of goods 592,834 656,706
Rendering of services 190,072 199,440
Royalty revenue 180,548 200,988
TOTAL 963,454 1,057,134
External revenue - by geographical areas
(€ in thousands) 2013 20121
Europe 710,101 772,818
North America 177,725 208,378
Rest of World 75,628 75,938
TOTAL 963,454 1,057,134
1The 2012 comparative figures have been adjusted to align with 2013 regional allocation of revenue.
The geographical split of our revenue from sale of goods and services is based on the location of the customers, while the split for royalty
revenue is based on the coverage of our geographical map data and other contents.
Total revenue generated in the Netherlands during 2013 amounted to €60 million (2012: €77 million).
The group has no significant concentration of sales from a particular individual external customer.
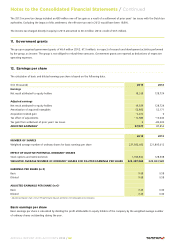
The non-current assets within TomTom include a significant portion of the carrying value of the step up resulting from the Tele Atlas acquisition
in 2008. As this step up is not geographically allocated to the respective regions for internal management reporting, we believe that disclosure
of geographic allocation would be highly judgemental and would not give a true representation of geographical spread of our assets.
Notes to the Consolidated Financial Statements / Continued
ANNUAL REPORT AND ACCOUNTS 2013 / 57