TomTom 2013 Annual Report Download - page 73
Download and view the complete annual report
Please find page 73 of the 2013 TomTom annual report below. You can navigate through the pages in the report by either clicking on the pages listed below, or by using the keyword search tool below to find specific information within the annual report.-
 1
1 -
2
-
3
-
4
-
5
-
6
-
7
-
8
-
9
-
10
-
11
-
12
-
13
-
14
-
15
-
16
-
17
-
18
-
19
-
20
-
21
-
22
-
23
-
24
-
25
-
26
-
27
-
28
-
29
-
30
-
31
-
32
-
33
-
34
-
35
-
36
-
37
-
38
-
39
-
40
-
41
-
42
-
43
-
44
-
45
-
46
-
47
-
48
-
49
-
50
-
51
-
52
-
53
-
54
-
55
-
56
-
57
-
58
-
59
-
60
-
61
-
62
-
 63
63 -
 64
64 -
 65
65 -
 66
66 -
 67
67 -
 68
68 -
 69
69 -
 70
70 -
 71
71 -
 72
72 -
 73
73 -
 74
74 -
 75
75 -
 76
76 -
 77
77 -
 78
78 -
 79
79 -
 80
80 -
 81
81 -
 82
82 -
 83
83 -
84
-
85
-
86
-
87
-
88
-
89
-
90
-
91
-
92
-
93
 |
 |

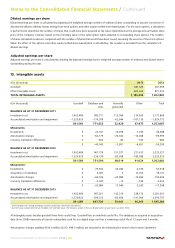
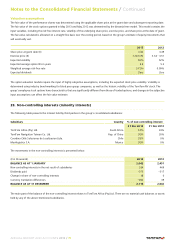
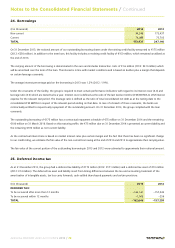
The movement of deferred tax is as follows:
(€ in thousands) Stock compensation
expense
Other Intangible
assets
Provisions Assessed
losses
Total
BALANCE AS AT 31 DECEMBER 2011 82 337 –225,089 4,150 48,740 –171,780
(Charged)/released to income 882 –606 16,100 4,596 –7,268 13,704
(Charged)/released to equity 0 0 0 503 0 503
Currency translation differences 0 –61 1,860 –134 –1,391 274
BALANCE AS AT 31 DECEMBER 2012 964 –330 –207,129 9,115 40,081 –157,299
Acquisition of subsidiaries 0 0 –5,279 0 685 –4,594
(Charged)/released to income 362 –265 15,794 –2,662 –14,841 –1,612
Currency translation differences 0 0 1,527 –215 147 1,459
BALANCE AS AT 31 DECEMBER 2013 1,326 –595 –195,087 6,238 26,072 –162,046
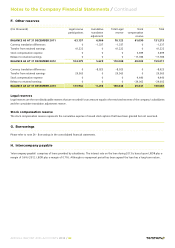
Deferred tax balances are presented in the balance sheet as follows:
(€ in thousands) 2013 2012
Deferred tax assets 9,681 13,610
Deferred tax liabilities –171,727 –170,909
TOTAL –162,046 –157,299
The group has in some jurisdictions tax losses carry forwards which have not been recognised as deferred tax assets as the amounts as well
as possible future recovery of these losses against future taxable income are uncertain. As at 31 December 2013, these losses amounted to
approximately €100 million.
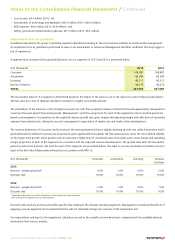
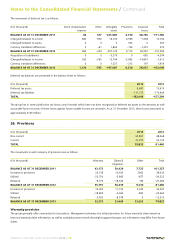
26. Provisions
(€ in thousands) 2013 2012
Non-current 55,857 48,268
Current 23,975 33,192
TOTAL 79,832 81,460
The movements in each category of provisions are as follows:
(€ in thousands) Warranty Claims &
litigations
Other Total
BALANCE AS AT 31 DECEMBER 2011 43,173 50,429 7,725 101,327
Increases in provisions 25,138 10,435 2462 38,035
Utilised –23,750 –5,895 –877 –30,522
Released –8,770 –18,530 –80 –27,380
BALANCE AS AT 31 DECEMBER 2012 35,791 36,439 9,230 81,460
Increases in provisions 19,022 11,105 5,320 35,447
Utilised –18,805 –5,362 –895 –25,062
Released –3,435 –8,578 0 –12,013
BALANCE AS AT 31 DECEMBER 2013 32,573 33,604 13,655 79,832
Warranty provision
The group generally offers warranties for its products. Management estimates the related provision for future warranty claims based on
historical warranty claim information, as well as evaluating recent trends that might suggest that past cost information may differ from future
claims.
Notes to the Consolidated Financial Statements / Continued
ANNUAL REPORT AND ACCOUNTS 2013 / 73