TomTom 2013 Annual Report Download - page 67
Download and view the complete annual report
Please find page 67 of the 2013 TomTom annual report below. You can navigate through the pages in the report by either clicking on the pages listed below, or by using the keyword search tool below to find specific information within the annual report.-
 1
1 -
2
-
3
-
4
-
5
-
6
-
7
-
8
-
9
-
10
-
11
-
12
-
13
-
14
-
15
-
16
-
17
-
18
-
19
-
20
-
21
-
22
-
23
-
24
-
25
-
26
-
27
-
28
-
29
-
30
-
31
-
32
-
33
-
34
-
35
-
36
-
37
-
38
-
39
-
40
-
41
-
42
-
43
-
44
-
45
-
46
-
47
-
48
-
49
-
50
-
51
-
52
-
53
-
54
-
55
-
56
-
 57
57 -
 58
58 -
 59
59 -
 60
60 -
 61
61 -
 62
62 -
 63
63 -
 64
64 -
 65
65 -
 66
66 -
 67
67 -
 68
68 -
 69
69 -
 70
70 -
 71
71 -
 72
72 -
 73
73 -
 74
74 -
 75
75 -
 76
76 -
 77
77 -
78
-
79
-
80
-
81
-
82
-
83
-
84
-
85
-
86
-
87
-
88
-
89
-
90
-
91
-
92
-
93
 |
 |

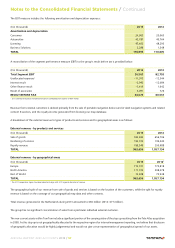
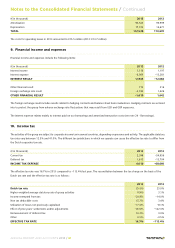
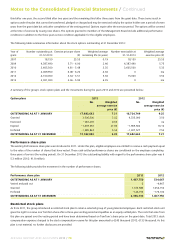
The amount of inventories recognised as an expense when the inventories are sold and included in cost of sales amounted to €320 million
(2012: €355 million).
As a result of the write-down of inventories to their net realisable value, the group recognised a cost of €2.7 million (2012: €10.8 million).
The costs are included in cost of sales.
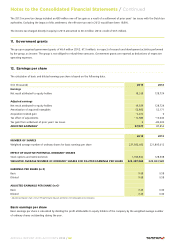
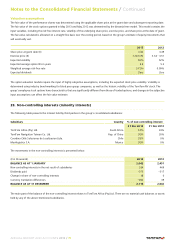
17. Trade receivables
(€ in thousands) 2013 2012
Gross trade receivables 118,546 151,697
Allowance for doubtful receivables –3,117 –1,863
TRADE RECEIVABLES (NET) 115,429 149,834
We expect to recover all receivables within a year. An allowance has been made for estimated unrecoverable amounts from the sale of goods.
The carrying amount of trade receivables approximates their fair value. The group does not hold any collateral over these balances.
The group's exposure to credit risk is influenced mainly by the individual characteristics of each customer. There is some concentration of
credit risk with certain of our large customers' accounts. Management actively monitors the credit risk related to these customers and takes
pro-active action to reduce credit limits if required.
The following table summarises the movement in the allowance for doubtful trade receivables account:
(€ in thousands) 2013 2012
BALANCE AS AT 1 JANUARY –1,863 –1,814
Additional receivables impairment –2,567 –1,856
Receivables written off during the year as uncollectible 410 1,163
Unused amounts reversed 654 635
Translation effects 249 9
BALANCE AS AT 31 DECEMBER –3,117 –1,863
The following table sets out details of the age of trade accounts receivable that are not overdue, as the payment terms specified in the terms
and conditions established with our customers have not been exceeded, and an analysis of overdue amounts and related provisions for
doubtful trade accounts receivable:
(€ in thousands) 2013 2012
Of which:
Not overdue 94,883 117,574
Overdue < 3 months 20,594 32,583
3 to 6 months 1,463 299
Over 6 months 1,606 1,241
Less provision –3,117 –1,863
TRADE RECEIVABLES (NET) 115,429 149,834
The provisions recorded in 2013 and 2012 are mainly related to the overdue amounts.
Notes to the Consolidated Financial Statements / Continued
ANNUAL REPORT AND ACCOUNTS 2013 / 67