TomTom 2013 Annual Report Download - page 72
Download and view the complete annual report
Please find page 72 of the 2013 TomTom annual report below. You can navigate through the pages in the report by either clicking on the pages listed below, or by using the keyword search tool below to find specific information within the annual report.-
 1
1 -
2
-
3
-
4
-
5
-
6
-
7
-
8
-
9
-
10
-
11
-
12
-
13
-
14
-
15
-
16
-
17
-
18
-
19
-
20
-
21
-
22
-
23
-
24
-
25
-
26
-
27
-
28
-
29
-
30
-
31
-
32
-
33
-
34
-
35
-
36
-
37
-
38
-
39
-
40
-
41
-
42
-
43
-
44
-
45
-
46
-
47
-
48
-
49
-
50
-
51
-
52
-
53
-
54
-
55
-
56
-
57
-
58
-
59
-
60
-
61
-
 62
62 -
 63
63 -
 64
64 -
 65
65 -
 66
66 -
 67
67 -
 68
68 -
 69
69 -
 70
70 -
 71
71 -
 72
72 -
 73
73 -
 74
74 -
 75
75 -
 76
76 -
 77
77 -
 78
78 -
 79
79 -
 80
80 -
 81
81 -
 82
82 -
83
-
84
-
85
-
86
-
87
-
88
-
89
-
90
-
91
-
92
-
93
 |
 |
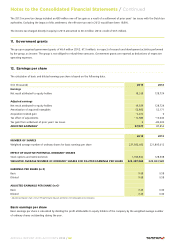
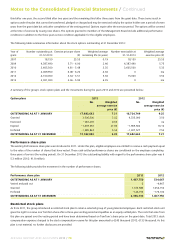
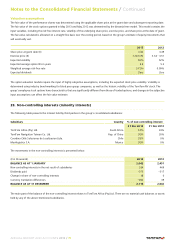
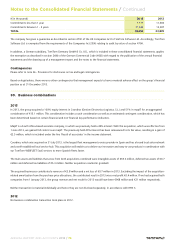
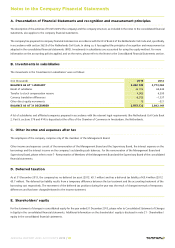
24. Borrowings
(€ in thousands) 2013 2012
Non-current 99,348 173,437
Current 74,089 73,703
TOTAL 173,437 247,140
On 31 December 2013, the notional amount of our outstanding borrowing drawn under the existing credit facility amounted to €175 million
(2012: €250 million). In addition to the term loan, this facility includes a revolving credit facility of €150 million, which remained unutilised at
the end of 2013.
The carrying amount of the borrowing is denominated in the euro and includes transaction costs of €1.6 million (2012: €2.9 million) which
will be amortised over the term of the loan. The interest is in line with market conditions and is based on Euribor plus a margin that depends
on certain leverage covenants.
The average interest percentage paid on the borrowing in 2013 was 1.2% (2012: 1.9%).
Under the covenants of the facility, the group is required to meet certain performance indicators with regard to its interest cover (4.0) and
leverage ratio (3.0) which are tested twice a year. Interest cover is defined as the ratio of the last twelve months (LTM) EBITDA to LTM interest
expense for the relevant test period. The leverage ratio is defined as the ratio of total consolidated net debt as at the testing date to the
consolidated LTM EBITDA in respect of the relevant period ending on that date. In case of a breach of these covenants, the banks are
contractually entitled to request early repayment of the outstanding amount. On 31 December 2013, the group complied with the loan
covenants.
The outstanding borrowing of €175 million has a contractual repayment schedule of €75 million on 31 December 2014 and the remaining
€100 million on 31 March 2016. Based on this maturity profile, the €75 million due on 31 December 2014 is presented as current liability and
the remaining €100 million as non-current liability.
As the contractual interest rate is based on market interest rates plus certain margin and the fact that there has been no significant change
to our credit rating, we estimate the fair value of the non-current borrowing at the end of 2013 and 2012 to approximate their carrying value.
The fair value of the current portion of the outstanding borrowing in 2013 and 2012 were estimated to approximate their notional amount.
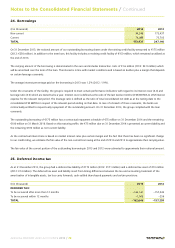
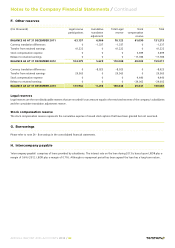
25. Deferred income tax
As at 31 December 2013, the group had a deferred tax liability of €172 million (2012: €171 million) and a deferred tax asset of €10 million
(2012: €14 million). The deferred tax asset and liability result from timing differences between the tax and accounting treatment of the
amortisation of intangible assets, tax loss carry forwards, cash-settled share-based payments and certain provisions.
(€ in thousands) 2013 2012
DEFFERED TAX:
To be recovered after more than 12 months –160,141 –157,043
To be recovered within 12 months –1,905 –256
TOTAL –162,046 –157,299
Notes to the Consolidated Financial Statements / Continued
ANNUAL REPORT AND ACCOUNTS 2013 / 72