TomTom 2008 Annual Report Download - page 63
Download and view the complete annual report
Please find page 63 of the 2008 TomTom annual report below. You can navigate through the pages in the report by either clicking on the pages listed below, or by using the keyword search tool below to find specific information within the annual report.-
 1
1 -
2
-
3
-
4
-
5
-
6
-
7
-
8
-
9
-
10
-
11
-
12
-
13
-
14
-
15
-
16
-
17
-
18
-
19
-
20
-
21
-
22
-
23
-
24
-
25
-
26
-
27
-
28
-
29
-
30
-
31
-
32
-
33
-
34
-
35
-
36
-
37
-
38
-
39
-
40
-
41
-
42
-
43
-
44
-
45
-
46
-
47
-
48
-
49
-
50
-
51
-
52
-
 53
53 -
 54
54 -
 55
55 -
 56
56 -
 57
57 -
 58
58 -
 59
59 -
 60
60 -
 61
61 -
 62
62 -
 63
63 -
 64
64 -
 65
65 -
 66
66 -
 67
67 -
 68
68 -
 69
69 -
 70
70 -
 71
71 -
 72
72 -
 73
73 -
74
-
75
-
76
-
77
-
78
-
79
-
80
-
81
-
82
-
83
-
84
 |
 |

/ 61
NOTES TO THE CONSOLIDATED FINANCIAL STATEMENTS
OF TOMTOM NV
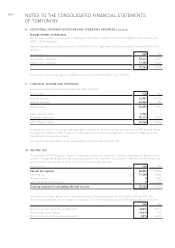
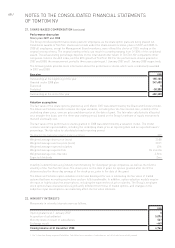
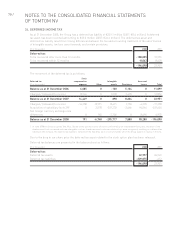
10. INCOME TAX (continued)
2008 2007
Dutch tax rate 25.5% 25.5%
Higher weighted average statutory rate on group activities 0.9% 1.1%
Permanent differences -4.5% 0.0%
Non tax deductible share options 5.7% 0.0%
Non tax deductible result associates 1.5% 0.0%
Other 1.7% -0.1%
Effective tax rate (excluding impairment) 30.8% 26.5%
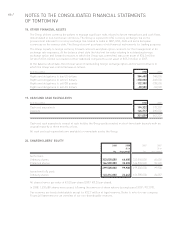
11. EARNINGS PER SHARE
The calculation of basic and diluted earnings per share is based on the following data.
2008 2007
Earnings (€ in thousands)
Earnings (net result attributable to equity holders) -872,585 317,242
Number of shares
Weighted average number of ordinary shares for basic earnings per share 122,467,193 113,759,244
Effect of dilutive potential ordinary shares
Share options 998,223 5,476,417
Weighted average number of ordinary shares for diluted earnings per share 123,465,416 119,235,661
Basic earnings per share
Basic earnings per share is calculated by dividing the profit attributable to equity holders of the company by the
weighted average number of ordinary shares outstanding during the year.
Diluted earnings per share
Diluted earnings per share is calculated by adjusting the weighted average number of ordinary shares
outstanding to assume conversion of all potential dilutive ordinary shares. The company has one category of
potential dilutive ordinary shares: share options. For these share options, a calculation is performed to determine
the number of shares that could have been acquired at fair value (determined as the average annual market
share price of the company’s shares), based on the monetary value of the subscription rights attached to
outstanding share options. The number of shares calculated as above is compared with the number of shares
that would have been issued, assuming the exercise of the share options. Given the company incurred losses in
2008, this results in the calculation being anti-dilutive and hence, the same number of shares and net loss per
share is presented for Basic and Diluted earnings per share.
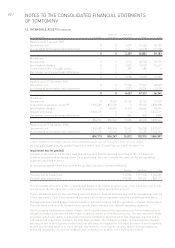
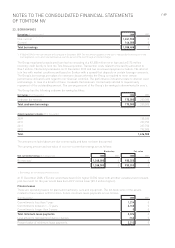
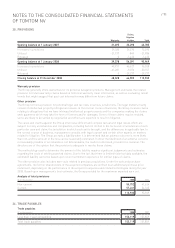
12. INTANGIBLE ASSETS
(€ in thousands) 2008 2007
Goodwill 854,713 0
Other intangible assets 1,011,194 56,344
Total intangible assets 1,865,907 56,344