TomTom 2008 Annual Report Download - page 18
Download and view the complete annual report
Please find page 18 of the 2008 TomTom annual report below. You can navigate through the pages in the report by either clicking on the pages listed below, or by using the keyword search tool below to find specific information within the annual report.-
 1
1 -
2
-
3
-
4
-
5
-
6
-
7
-
 8
8 -
 9
9 -
 10
10 -
 11
11 -
 12
12 -
 13
13 -
 14
14 -
 15
15 -
 16
16 -
 17
17 -
 18
18 -
 19
19 -
 20
20 -
 21
21 -
 22
22 -
 23
23 -
 24
24 -
 25
25 -
 26
26 -
 27
27 -
 28
28 -
29
-
30
-
31
-
32
-
33
-
34
-
35
-
36
-
37
-
38
-
39
-
40
-
41
-
42
-
43
-
44
-
45
-
46
-
47
-
48
-
49
-
50
-
51
-
52
-
53
-
54
-
55
-
56
-
57
-
58
-
59
-
60
-
61
-
62
-
63
-
64
-
65
-
66
-
67
-
68
-
69
-
70
-
71
-
72
-
73
-
74
-
75
-
76
-
77
-
78
-
79
-
80
-
81
-
82
-
83
-
84
 |
 |

MANAGEMENT BOARD REPORT
16 /
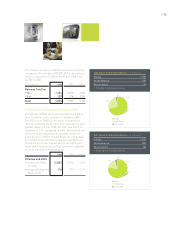
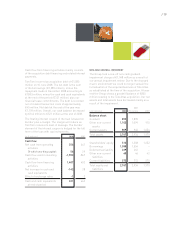
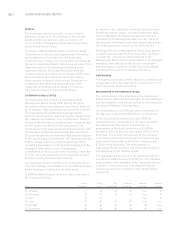
TomTom geography
In 2008, TomTom generated revenue in EMEA, North
America and Asia Pacific. Except for North America
all regions showed a decrease in sales. The
proportion of sales outside EMEA rose to 29% in
2008, up from 20% in 2007.
Sales generated in North America showed an
increase to €398 million in 2008 up from €271 million
in 2007. Revenue in North America represented 26%
of TomTom revenue, up from 16% in the previous year.
In EMEA, revenue decreased by 21% to €1.1 billion,
down from €1.4 billion in 2007. Asia Pacific sales
were down 28% to €51 million from €70 million
in 2007.
(in € millions) 2008 2007 Change
TomTom revenues
per region
Europe 1,103 1,396 -21%
North America 398 271 47%
Rest of world 51 70 -28%
Total 1,553 1,737 -11%
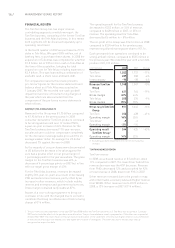
TomTom gross result
Our gross profit remained strong at 40% for the
year, a decrease of 4 percentage points compared to
last year. The gross profit decreased to €621 million,
a decrease of €143 million over 2007.
The majority of our trade purchases and an
increasing part of our revenues are denominated in
US dollars. During 2008, we benefited from the
weakening of the US dollar against the euro. On
average, the US dollar rate weakened by 7%
compared to 2007, which mitigated our gross
margin decrease for 2008 by 1 percentage point.
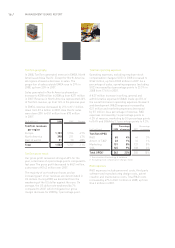
TomTom operating expenses
Operating expenses, excluding employee stock
compensation charges (SOC) in 2008 increased to
€362 million, up from €305 million in 2007. As a
percentage of sales, operating expenses (excluding
SOC) increased by 6 percentage points to 23.3% in
2008 from 17.6% in 2007.
A€37 million increase in selling, general and
administrative expensed (SG&A) made up 65% of
the overall increase in operating expenses. Research
and development (R&D) expenses increased by
€21 million and marketing expenses decreased
by €7 million. As a percentage of revenue, R&D
expenses increased by 1.6 percentage points to
4.2% of revenue, marketing by 0.5 percentage points
to 8.4% and SG&A by 3.1 percentage points to 9.3%.
Percentage Percentage
(in € millions) 2008 of revenue 2007 of revenue
TomTom OPEX
R&D 65 4% 44 3%
Amort. of T&D122 1% 16 1%
Marketing 131 8% 137 8%
SGA 145 9% 108 6%
Total OPEX2362 23% 305 18%
1 Amortisation of technology & database
2 Excluding stock compensation charges (SOC)
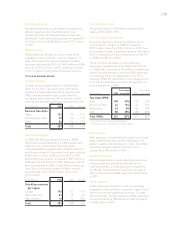
R&D expenses
R&D expenses include personnel costs, third party
software and manufacturing design costs, patent
creation and maintenance costs. Total R&D costs
increased by 47% to €65.1 million in 2008, up from
€44.2 million in 2007.