TomTom 2008 Annual Report Download - page 17
Download and view the complete annual report
Please find page 17 of the 2008 TomTom annual report below. You can navigate through the pages in the report by either clicking on the pages listed below, or by using the keyword search tool below to find specific information within the annual report.-
 1
1 -
2
-
3
-
4
-
5
-
6
-
 7
7 -
 8
8 -
 9
9 -
 10
10 -
 11
11 -
 12
12 -
 13
13 -
 14
14 -
 15
15 -
 16
16 -
 17
17 -
 18
18 -
 19
19 -
 20
20 -
 21
21 -
 22
22 -
 23
23 -
 24
24 -
 25
25 -
 26
26 -
 27
27 -
28
-
29
-
30
-
31
-
32
-
33
-
34
-
35
-
36
-
37
-
38
-
39
-
40
-
41
-
42
-
43
-
44
-
45
-
46
-
47
-
48
-
49
-
50
-
51
-
52
-
53
-
54
-
55
-
56
-
57
-
58
-
59
-
60
-
61
-
62
-
63
-
64
-
65
-
66
-
67
-
68
-
69
-
70
-
71
-
72
-
73
-
74
-
75
-
76
-
77
-
78
-
79
-
80
-
81
-
82
-
83
-
84
 |
 |

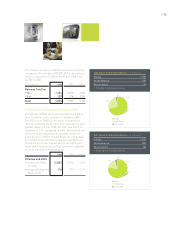
Europe
71%
3%
26%
North America
Rest of world
Europe
79%
4%
17%
North America
Rest of world
/ 15
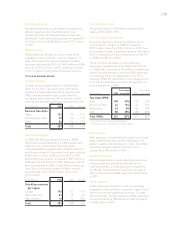
The revenue increase in WORK came from a strong
increase in the number of WEBFLEET subscriptions,
which increased to 67,000 at the end of 2008 from
34,000 in 2007.
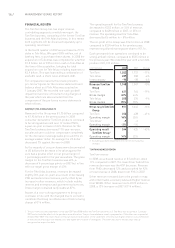
(in € millions) 2008 2007 Change
Revenue TomTom
PNDs 1,424 1,623 -12%
Other 129 114 13%
Total 1,553 1,737 -11%
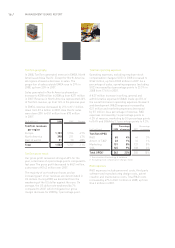
TomTom volume and average selling price (ASP)
The volume of PND units sold increased in 2008 to
over 12 million units, up from 9.6 million in 2007.
The ASP of our PNDs is the result of a variety of
factors, including the product mix, regional mix and
market dynamics. For 2008, the ASP was €118, a
decrease of 31% compared to 2007. The main driver
behind this decrease was the general decline in
sales prices for PNDs, mainly driven by component
price reductions, and the increased importance of
the North American market where our ASPs were
lower due to a product mix that contained relatively
more of our value range products.
2008 2007 Change
Volumes and ASPs
Volume sold PNDs 12,032 9,575 26%
(in ’000)
Average selling price 118 170 -31%
PNDs (in €)
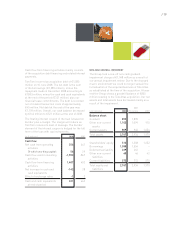
2008 GROUP REVENUE BY REGION (in €millions)*
Europe 1,295
North America 479
Rest of world 67
* Including intercompany revenue
2007 GROUP REVENUE BY REGION (in €millions)*
Europe 1,613
North America 350
Rest of world 83
* Including intercompany revenue