TomTom 2008 Annual Report Download - page 59
Download and view the complete annual report
Please find page 59 of the 2008 TomTom annual report below. You can navigate through the pages in the report by either clicking on the pages listed below, or by using the keyword search tool below to find specific information within the annual report.-
 1
1 -
2
-
3
-
4
-
5
-
6
-
7
-
8
-
9
-
10
-
11
-
12
-
13
-
14
-
15
-
16
-
17
-
18
-
19
-
20
-
21
-
22
-
23
-
24
-
25
-
26
-
27
-
28
-
29
-
30
-
31
-
32
-
33
-
34
-
35
-
36
-
37
-
38
-
39
-
40
-
41
-
42
-
43
-
44
-
45
-
46
-
47
-
48
-
 49
49 -
 50
50 -
 51
51 -
 52
52 -
 53
53 -
 54
54 -
 55
55 -
 56
56 -
 57
57 -
 58
58 -
 59
59 -
 60
60 -
 61
61 -
 62
62 -
 63
63 -
 64
64 -
 65
65 -
 66
66 -
 67
67 -
 68
68 -
 69
69 -
70
-
71
-
72
-
73
-
74
-
75
-
76
-
77
-
78
-
79
-
80
-
81
-
82
-
83
-
84
 |
 |

/ 57
NOTES TO THE CONSOLIDATED FINANCIAL STATEMENTS
OF TOMTOM NV
4. CRITICAL ACCOUNTING ESTIMATES AND JUDGEMENTS (continued)
5. Provisions
For our critical accounting estimates and judgements on provisions, refer to note 25.
6. Doubtful receivables provision
The Group makes allowances for doubtful receivables arising from its trading activities. In doing so, it makes
estimates based on its historical experience of doubtful receivables rates, depending on the age of the
relevant receivable and specific knowledge of the client and the industry. Revisions to accounting estimates
are recognised in the period in which the estimate is revised if the revision affects only that period, or in the
period of revision and future periods if the revision affects both current and future periods.
7. Capitalised databases and tools
Internally generated databases and tools are capitalised in accordance with IAS 38. Assumptions are made
regarding the estimated level of completion. At the point where activities no longer relate to development but
to upgrading and maintenance, capitalisation is discontinued. Management are also required to make
judgements in respect of developed software tools. For additional information refer to note 12.
8. Income taxes
Deferred taxes are recognised for all unused tax losses to the extent that it is probable that taxable profit will
be available against which the losses can be utilised. Significant management judgement is required to
determine the amount of deferred tax assets that can be recognised, based upon the likely timing and level of
future taxable profits together with future tax planning strategies.
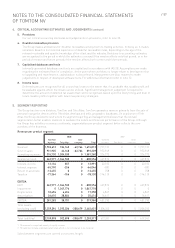
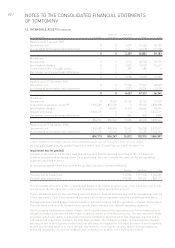
5. SEGMENT REPORTING
The Group has two core divisions, TomTom and Tele Atlas. TomTom generates revenue primarily from the sale of
personal navigation devices whilst Tele Atlas develops and sells geographic databases. On acquisition of Tele
Atlas the Group decided to restructure its segment reporting as management believes that the revised
segmentation better enables investors to evaluate the nature and financial performance of the Group. Although
the Group has activities on various continents, segmentation per product segment better reflects the core
activities of the business.
Revenue per product segment
2008 2007
TomTom Inter TomTom Inter
business Tele Atlas company Total business Tele Atlas company Total
Revenue11,552,612 184,165 -62,764 1,674,013 1,737,133 001,737,133
Cost of sales 931,905 24,168 -62,764 893,309 972,949 00972,949
Operating expenses 376,730 1,204,530 0 1,581,260 336,372 00336,372
Operating result 243,977 -1,044,533 0 -800,556 427,812 00427,812
Interest income 13,134 857 0 13,991 20,102 0020,102
Interest expense -65,790 -256 0 -66,046 -981 00-981
Result of associate -13,455 00-13,455 758 00758
Taxation -77,364 -766 0 -78,130 -114,119 00-114,119
EBITDA
EBIT 243,977 -1,044,533 0 -800,556 427,812 00427,812
Impairment 0 1,047,776 0 1,047,776 0000
Depreciation 10,696 6,654 0 17,350 6,867 006,867
Amortisation 26,610 28,804 0 55,414 16,611 0016,611
EBITDA 281,283 38,701 0 319,984 451,290 00451,290
Total assets
(excluding cash) 1,259,294 1,395,036 -208,679 2,445,651 1,506,242 001,506,252
Total liabilities22,159,098 302,898 -208,679 2,253,317 617,241 00617,241
1 TA revenue is comprised mainly of royalty income.
2 TA liabilities include a defined benefit plan which is not considered to be material.
Sales between segments are carried out at arms length.