Supercuts 2008 Annual Report Download - page 50
Download and view the complete annual report
Please find page 50 of the 2008 Supercuts annual report below. You can navigate through the pages in the report by either clicking on the pages listed below, or by using the keyword search tool below to find specific information within the annual report.-
 1
1 -
2
-
3
-
4
-
5
-
6
-
7
-
8
-
9
-
10
-
11
-
12
-
13
-
14
-
15
-
16
-
17
-
18
-
19
-
20
-
21
-
22
-
23
-
24
-
25
-
26
-
27
-
28
-
29
-
30
-
31
-
32
-
33
-
34
-
35
-
36
-
37
-
38
-
39
-
 40
40 -
 41
41 -
 42
42 -
 43
43 -
 44
44 -
 45
45 -
 46
46 -
 47
47 -
 48
48 -
 49
49 -
 50
50 -
 51
51 -
 52
52 -
 53
53 -
 54
54 -
 55
55 -
 56
56 -
 57
57 -
 58
58 -
 59
59 -
 60
60 -
61
-
62
-
63
-
64
-
65
-
66
-
67
-
68
-
69
-
70
-
71
-
72
-
73
-
74
-
75
-
76
-
77
-
78
-
79
-
80
-
81
-
82
-
83
-
84
-
85
-
86
-
87
-
88
-
89
-
90
-
91
-
92
-
93
-
94
-
95
-
96
-
97
-
98
-
99
-
100
-
101
-
102
-
103
-
104
-
105
-
106
-
107
-
108
-
109
-
110
-
111
-
112
-
113
-
114
-
115
-
116
-
117
-
118
-
119
-
120
-
121
-
122
-
123
-
124
-
125
-
126
-
127
-
128
-
129
-
130
-
131
-
132
-
133
-
134
-
135
-
136
-
137
-
138
-
139
-
140
-
141
-
142
-
143
-
144
-
145
-
146
-
147
-
148
-
149
-
150
-
151
-
152
-
153
-
154
-
155
-
156
-
157
-
158
-
159
-
160
-
161
-
162
-
163
-
164
-
165
-
166
-
167
-
168
-
169
-
170
-
171
-
172
-
173
-
174
-
175
-
176
-
177
-
178
-
179
-
180
-
181
-
182
-
183
-
184
-
185
-
186
-
187
-
188
-
189
-
190
-
191
-
192
-
193
-
194
-
195
-
196
-
197
-
198
-
199
-
200
-
201
-
202
-
203
-
204
-
205
-
206
-
207
-
208
-
209
-
210
-
211
-
212
-
213
-
214
-
215
-
216
-
217
-
218
-
219
-
220
-
221
-
222
-
223
-
224
-
225
-
226
-
227
-
228
-
229
-
230
-
231
-
232
-
233
-
234
-
235
-
236
-
237
-
238
-
239
-
240
-
241
-
242
-
243
-
244
-
245
-
246
-
247
-
248
-
249
-
250
-
251
-
252
-
253
-
254
-
255
-
256
-
257
-
258
-
259
-
260
-
261
-
262
-
263
-
264
-
265
-
266
-
267
-
268
-
269
-
270
-
271
-
272
-
273
-
274
-
275
-
276
-
277
-
278
-
279
-
280
-
281
-
282
-
283
-
284
-
285
 |
 |

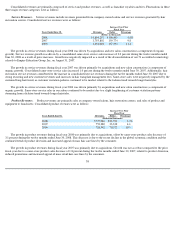
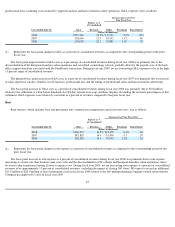
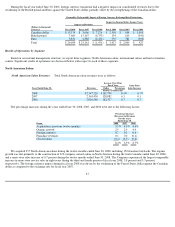
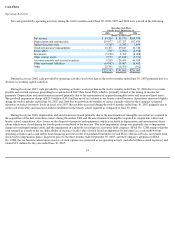
We acquired 338 North American salons during the twelve months ended June 30, 2007, including 93 franchise buybacks. The organic
growth was due primarily to the construction of 395 company-owned salons in North America during the twelve months ended June 30, 2007,
partially offset by a lower same-store sales increase of 0.1 percent during the twelve months ended June 30, 2007 as compared to 0.7 percent
during the twelve months ended June 30, 2006. The foreign currency impact during fiscal year 2007 was driven by the weakening of the United
States dollar against the Canadian dollar as compared to the exchange rate for fiscal year 2006.
We acquired 278 North American salons during the twelve months ended June 30, 2006, including 140 franchise buybacks. The organic
growth stemmed primarily from the construction of 498 company-owned salons in North America during the twelve months ended June 30,
2006. The foreign currency impact during fiscal year 2006 was driven by the weakening of the United States dollar against the Canadian dollar
as compared to the exchange rate for fiscal year 2005.
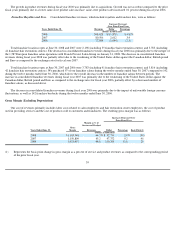
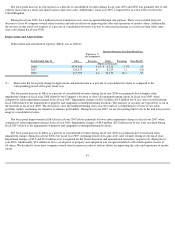
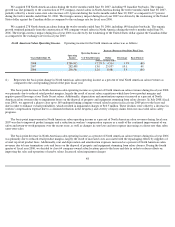
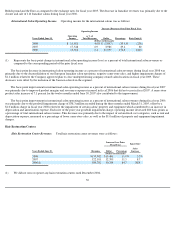
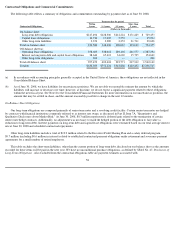
North American Salon Operating Income. Operating income for the North American salons was as follows:
(1)
Increase (Decrease) Over Prior Fiscal Year
Years Ended June 30,
Operating
Income
Operating Income as
% of Total Revenues
Dollar
Percentage
Basis Point(1)
(Dollars in thousands)
2008
$
286,812
12.2
%
$
4,314
1.5
%
(80
)
2007
282,498
13.0
25,937
10.1
40
2006
256,561
12.6
8,481
3.4
(60
)
Represents the basis point change in North American salon operating income as a percent of total North American salon revenues as
compared to the corresponding period of the prior fiscal year.
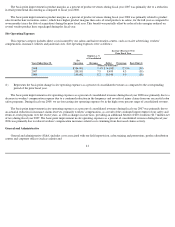
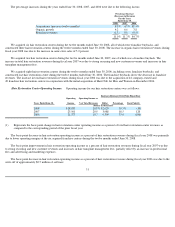
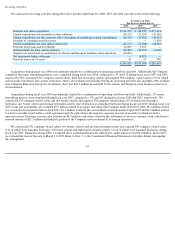
The basis point decrease in North American salon operating income as a percent of North American salon revenues during fiscal year 2008
was primarily due to reduced retail product margins, largely the result of recent salon acquisitions which have lower product margins and
negative payroll leverage at our Trade Secret salons. Additionally, depreciation and amortization expenses increased as a percent of North
American salon revenues due to impairment losses on the disposal of property and equipment stemming from salon closures. In July 2008 (fiscal
year 2009), we approved a plan to close up to 160 underperforming company
-owned salon locations in fiscal year 2009 prior to the lease end
date in order to enhance overall profitability, which resulted in impairment charges of $10.5 million. These declines were offset by a decrease in
workers' compensation expense due to a continued reduction in the frequency and severity of injury claims from our successful salon safety
programs.
The basis point improvement in North American salon operating income as a percent of North American salon revenues during fiscal year
2007 was due to improved product margins and a reduction in workers' compensation expense as a result of the continued improvement of our
safety and return-to-work programs over the recent years, as well as changes in state laws and rent expense increasing at a faster rate than salon
same-store sales.
The basis point decrease in North American salon operating income as a percent of North American salon revenues during fiscal year 2006
was primarily due to reduced retail product margins, largely the result of increased costs associated with the repackaging efforts by suppliers of
several top retail product lines. Additionally, rent and depreciation and amortization expenses increased as a percent of North American salon
revenues due to lease termination costs and losses on the disposal of property and equipment stemming from salon closures. During the fourth
quarter of fiscal year 2006, we decided to close 64 company-owned salon locations prior to the lease end date in order to refocus efforts on
improving the sales and operations of nearby salons. Increased salon impairment charges
48