Supercuts 2008 Annual Report Download - page 49
Download and view the complete annual report
Please find page 49 of the 2008 Supercuts annual report below. You can navigate through the pages in the report by either clicking on the pages listed below, or by using the keyword search tool below to find specific information within the annual report.-
 1
1 -
2
-
3
-
4
-
5
-
6
-
7
-
8
-
9
-
10
-
11
-
12
-
13
-
14
-
15
-
16
-
17
-
18
-
19
-
20
-
21
-
22
-
23
-
24
-
25
-
26
-
27
-
28
-
29
-
30
-
31
-
32
-
33
-
34
-
35
-
36
-
37
-
38
-
 39
39 -
 40
40 -
 41
41 -
 42
42 -
 43
43 -
 44
44 -
 45
45 -
 46
46 -
 47
47 -
 48
48 -
 49
49 -
 50
50 -
 51
51 -
 52
52 -
 53
53 -
 54
54 -
 55
55 -
 56
56 -
 57
57 -
 58
58 -
 59
59 -
60
-
61
-
62
-
63
-
64
-
65
-
66
-
67
-
68
-
69
-
70
-
71
-
72
-
73
-
74
-
75
-
76
-
77
-
78
-
79
-
80
-
81
-
82
-
83
-
84
-
85
-
86
-
87
-
88
-
89
-
90
-
91
-
92
-
93
-
94
-
95
-
96
-
97
-
98
-
99
-
100
-
101
-
102
-
103
-
104
-
105
-
106
-
107
-
108
-
109
-
110
-
111
-
112
-
113
-
114
-
115
-
116
-
117
-
118
-
119
-
120
-
121
-
122
-
123
-
124
-
125
-
126
-
127
-
128
-
129
-
130
-
131
-
132
-
133
-
134
-
135
-
136
-
137
-
138
-
139
-
140
-
141
-
142
-
143
-
144
-
145
-
146
-
147
-
148
-
149
-
150
-
151
-
152
-
153
-
154
-
155
-
156
-
157
-
158
-
159
-
160
-
161
-
162
-
163
-
164
-
165
-
166
-
167
-
168
-
169
-
170
-
171
-
172
-
173
-
174
-
175
-
176
-
177
-
178
-
179
-
180
-
181
-
182
-
183
-
184
-
185
-
186
-
187
-
188
-
189
-
190
-
191
-
192
-
193
-
194
-
195
-
196
-
197
-
198
-
199
-
200
-
201
-
202
-
203
-
204
-
205
-
206
-
207
-
208
-
209
-
210
-
211
-
212
-
213
-
214
-
215
-
216
-
217
-
218
-
219
-
220
-
221
-
222
-
223
-
224
-
225
-
226
-
227
-
228
-
229
-
230
-
231
-
232
-
233
-
234
-
235
-
236
-
237
-
238
-
239
-
240
-
241
-
242
-
243
-
244
-
245
-
246
-
247
-
248
-
249
-
250
-
251
-
252
-
253
-
254
-
255
-
256
-
257
-
258
-
259
-
260
-
261
-
262
-
263
-
264
-
265
-
266
-
267
-
268
-
269
-
270
-
271
-
272
-
273
-
274
-
275
-
276
-
277
-
278
-
279
-
280
-
281
-
282
-
283
-
284
-
285
 |
 |

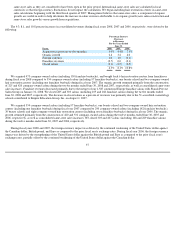
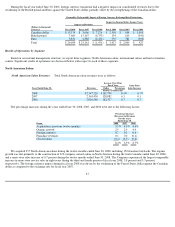
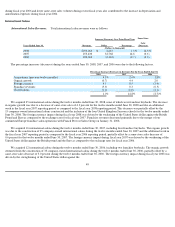
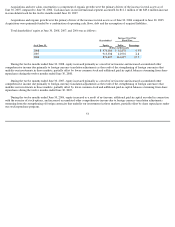
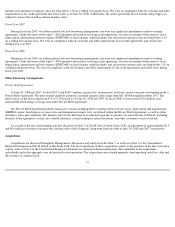
During the fiscal year ended June 30, 2006, foreign currency translation had a negative impact on consolidated revenues due to the
weakening of the British pound and Euro against the United States dollar, partially offset by the strengthening of the Canadian dollar.
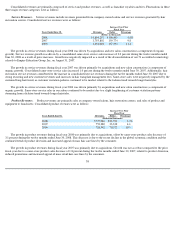
Results of Operations by Segment
Based on our internal management structure, we report three segments: North American salons, international salons and hair restoration
centers. Significant results of operations are discussed below with respect to each of these segments.
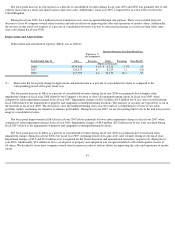
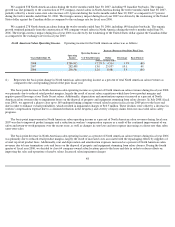
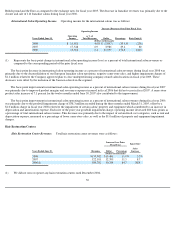
North American Salons
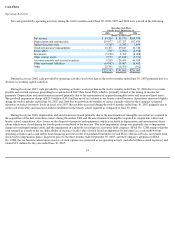
North American Salon Revenues. Total North American salon revenues were as follows:
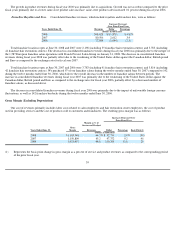
The percentage increases during the years ended June 30, 2008, 2007, and 2006 were due to the following factors:
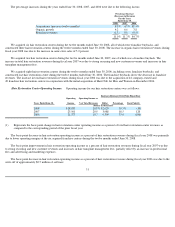
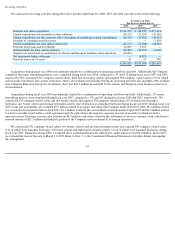
We acquired 357 North American salons during the twelve months ended June 30, 2008, including 150 franchise buybacks. The organic
growth was due primarily to the construction of 310 company-owned salons in North America during the twelve months ended June 30, 2008,
and a same-store sales increase of 0.7 percent during the twelve months ended June 30, 2008. The Company experienced the largest comparable
increase in same-store service sales in eight years during the third and fourth quarter of fiscal year 2008, 3.8 percent and 3.3 percent,
respectively. The foreign currency impact during fiscal year 2008 was driven by the weakening of the United States dollar against the Canadian
dollar as compared to the exchange rate for fiscal year 2007.
47
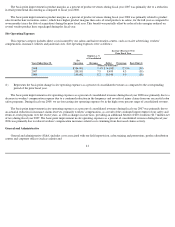
Favorable (Unfavorable) Impact of Foreign Currency Exchange Rate Fluctuations
Impact on Income Before Income Taxes
Impact on Revenues
Fiscal 2008
Fiscal 2007
Fiscal 2006
(Dollars in thousands)
Currency
Fiscal 2008
Fiscal 2007
Fiscal 2006
Canadian dollar
$
15,179
$
3,606
$
7,274
$
2,538
$
608
$
1,060
British pound
7,689
15,167
(6,753
)
134
616
(341
)
Euro
3,831
4,388
(2,472
)
755
782
(292
)
Total
$
26,699
$
23,161
$
(1,951
)
$
3,427
$
2,006
$
427
Increase Over Prior
Fiscal Year
Same
-
Store
Sales Increase
Years Ended June 30,
Revenues
Dollar
Percentage
(Dollars in thousands)
2008
$
2,347,220
$
181,790
8.4
%
0.7
%
2007
2,165,430
128,882
6.3
0.1
2006
2,036,548
162,337
8.7
0.7
Percentage Increase
(Decrease) in Revenues
For the Years
Ended June 30,
Factor 2008 2007 2006
Acquisitions (previous twelve months)
5.1
%
4.0
%
4.4
%
Organic growth
2.9
2.6
4.4
Foreign currency
0.7
0.2
0.4
Franchise revenues
0.1
0.0
(0.1
)
Closed salons
(0.4
)
(0.5
)
(0.4
)
8.4
%
6.3
%
8.7
%