Supercuts 2008 Annual Report Download - page 44
Download and view the complete annual report
Please find page 44 of the 2008 Supercuts annual report below. You can navigate through the pages in the report by either clicking on the pages listed below, or by using the keyword search tool below to find specific information within the annual report.-
 1
1 -
2
-
3
-
4
-
5
-
6
-
7
-
8
-
9
-
10
-
11
-
12
-
13
-
14
-
15
-
16
-
17
-
18
-
19
-
20
-
21
-
22
-
23
-
24
-
25
-
26
-
27
-
28
-
29
-
30
-
31
-
32
-
33
-
 34
34 -
 35
35 -
 36
36 -
 37
37 -
 38
38 -
 39
39 -
 40
40 -
 41
41 -
 42
42 -
 43
43 -
 44
44 -
 45
45 -
 46
46 -
 47
47 -
 48
48 -
 49
49 -
 50
50 -
 51
51 -
 52
52 -
 53
53 -
 54
54 -
55
-
56
-
57
-
58
-
59
-
60
-
61
-
62
-
63
-
64
-
65
-
66
-
67
-
68
-
69
-
70
-
71
-
72
-
73
-
74
-
75
-
76
-
77
-
78
-
79
-
80
-
81
-
82
-
83
-
84
-
85
-
86
-
87
-
88
-
89
-
90
-
91
-
92
-
93
-
94
-
95
-
96
-
97
-
98
-
99
-
100
-
101
-
102
-
103
-
104
-
105
-
106
-
107
-
108
-
109
-
110
-
111
-
112
-
113
-
114
-
115
-
116
-
117
-
118
-
119
-
120
-
121
-
122
-
123
-
124
-
125
-
126
-
127
-
128
-
129
-
130
-
131
-
132
-
133
-
134
-
135
-
136
-
137
-
138
-
139
-
140
-
141
-
142
-
143
-
144
-
145
-
146
-
147
-
148
-
149
-
150
-
151
-
152
-
153
-
154
-
155
-
156
-
157
-
158
-
159
-
160
-
161
-
162
-
163
-
164
-
165
-
166
-
167
-
168
-
169
-
170
-
171
-
172
-
173
-
174
-
175
-
176
-
177
-
178
-
179
-
180
-
181
-
182
-
183
-
184
-
185
-
186
-
187
-
188
-
189
-
190
-
191
-
192
-
193
-
194
-
195
-
196
-
197
-
198
-
199
-
200
-
201
-
202
-
203
-
204
-
205
-
206
-
207
-
208
-
209
-
210
-
211
-
212
-
213
-
214
-
215
-
216
-
217
-
218
-
219
-
220
-
221
-
222
-
223
-
224
-
225
-
226
-
227
-
228
-
229
-
230
-
231
-
232
-
233
-
234
-
235
-
236
-
237
-
238
-
239
-
240
-
241
-
242
-
243
-
244
-
245
-
246
-
247
-
248
-
249
-
250
-
251
-
252
-
253
-
254
-
255
-
256
-
257
-
258
-
259
-
260
-
261
-
262
-
263
-
264
-
265
-
266
-
267
-
268
-
269
-
270
-
271
-
272
-
273
-
274
-
275
-
276
-
277
-
278
-
279
-
280
-
281
-
282
-
283
-
284
-
285
 |
 |

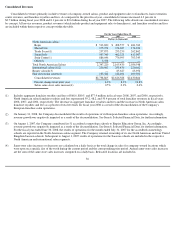
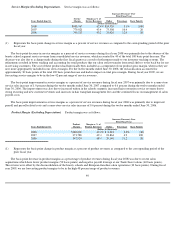
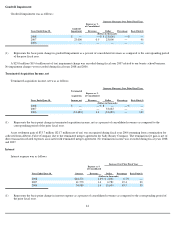
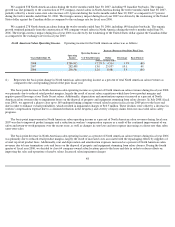
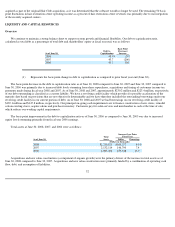
professional fees), including costs incurred to support franchise and hair restoration center operations. G&A expenses were as follows:
(1)
Increase (Decrease) Over
Prior Fiscal Year
Years Ended June 30,
G&A
Expense as %
of Consolidated
Revenues
Dollar
Percentage
Basis Point(1)
(Dollars in thousands)
2008
$
337,160
12.3
%
$
8,516
2.6
%
(20
)
2007
328,644
12.5
34,552
11.7
40
2006
294,092
12.1
33,885
13.0
20
Represents the basis point change in G&A as a percent of consolidated revenues as compared to the corresponding period of the prior
fiscal year.
The basis point improvement in G&A costs as a percentage of consolidated revenues during fiscal year 2008 was primarily due to the
deconsolidation of the European franchise salon operations and accredited cosmetology schools, partially offset by the payroll costs of the back
office support functions associated with the PureBeauty transaction. During fiscal year 2009, we are forecasting G&A expenses to be in the high
11 percent range of consolidated revenues.
The planned basis point increase in G&A costs as a percent of consolidated revenues during fiscal year 2007 was primarily due to increases
in salon supervisor salaries, benefits, travel expenses, professional fees and the timing of promotional salon and hair restoration advertising.
The basis point increase in G&A costs as a percent of consolidated revenues during fiscal year 2006 was primarily due to $2.8 million
related to the settlement of a Fair Labor Standards Act (FLSA) lawsuit over wage and hour disputes. Excluding the ten basis point impact of this
settlement, G&A expenses were relatively consistent as a percent of revenues compared to the prior fiscal year.
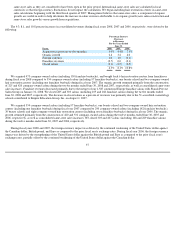
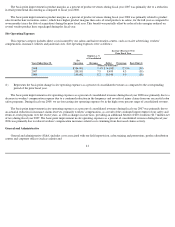
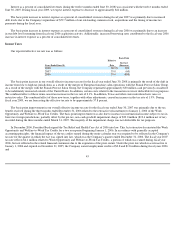
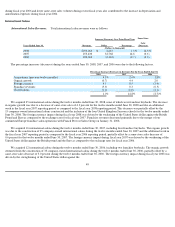
Rent
Rent expense, which includes base and percentage rent, common area maintenance and real estate taxes, was as follows:
(1)
Increase Over Prior Fiscal Year
Years Ended June 30,
Rent
Expense as %
of Consolidated
Revenues
Dollar
Percentage
Basis Point(1)
(Dollars in thousands)
2008
$
406,270
14.8
%
$
23,450
6.1
%
20
2007
382,820
14.6
31,894
9.1
20
2006
350,926
14.4
39,942
12.8
20
Represents the basis point change in rent expense as a percent of consolidated revenues as compared to the corresponding period of the
prior fiscal year.
The basis point increase in rent expense as a percent of consolidated revenues during fiscal year 2008 was primarily due to rent expense
increasing at a faster rate than location same-store sales and the deconsolidation of the schools and European franchise salon operations, offset
by recent salon acquisitions having a lower occupancy cost. During fiscal year 2009, we are forecasting rent expense as a percent of consolidated
revenues to be approximately 15 percent of consolidated revenues, excluding the impact of closing 160 stores. We expect to record an additional
$15.0 million to $20.0 million of lease termination costs in fiscal year 2009 related to the 160 underperforming Company-owned salons that the
Company has approved to close in fiscal year 2009.
42