Supercuts 2008 Annual Report Download - page 112
Download and view the complete annual report
Please find page 112 of the 2008 Supercuts annual report below. You can navigate through the pages in the report by either clicking on the pages listed below, or by using the keyword search tool below to find specific information within the annual report.-
 1
1 -
2
-
3
-
4
-
5
-
6
-
7
-
8
-
9
-
10
-
11
-
12
-
13
-
14
-
15
-
16
-
17
-
18
-
19
-
20
-
21
-
22
-
23
-
24
-
25
-
26
-
27
-
28
-
29
-
30
-
31
-
32
-
33
-
34
-
35
-
36
-
37
-
38
-
39
-
40
-
41
-
42
-
43
-
44
-
45
-
46
-
47
-
48
-
49
-
50
-
51
-
52
-
53
-
54
-
55
-
56
-
57
-
58
-
59
-
60
-
61
-
62
-
63
-
64
-
65
-
66
-
67
-
68
-
69
-
70
-
71
-
72
-
73
-
74
-
75
-
76
-
77
-
78
-
79
-
80
-
81
-
82
-
83
-
84
-
85
-
86
-
87
-
88
-
89
-
90
-
91
-
92
-
93
-
94
-
95
-
96
-
97
-
98
-
99
-
100
-
101
-
 102
102 -
 103
103 -
 104
104 -
 105
105 -
 106
106 -
 107
107 -
 108
108 -
 109
109 -
 110
110 -
 111
111 -
 112
112 -
 113
113 -
 114
114 -
 115
115 -
 116
116 -
 117
117 -
 118
118 -
 119
119 -
 120
120 -
 121
121 -
 122
122 -
123
-
124
-
125
-
126
-
127
-
128
-
129
-
130
-
131
-
132
-
133
-
134
-
135
-
136
-
137
-
138
-
139
-
140
-
141
-
142
-
143
-
144
-
145
-
146
-
147
-
148
-
149
-
150
-
151
-
152
-
153
-
154
-
155
-
156
-
157
-
158
-
159
-
160
-
161
-
162
-
163
-
164
-
165
-
166
-
167
-
168
-
169
-
170
-
171
-
172
-
173
-
174
-
175
-
176
-
177
-
178
-
179
-
180
-
181
-
182
-
183
-
184
-
185
-
186
-
187
-
188
-
189
-
190
-
191
-
192
-
193
-
194
-
195
-
196
-
197
-
198
-
199
-
200
-
201
-
202
-
203
-
204
-
205
-
206
-
207
-
208
-
209
-
210
-
211
-
212
-
213
-
214
-
215
-
216
-
217
-
218
-
219
-
220
-
221
-
222
-
223
-
224
-
225
-
226
-
227
-
228
-
229
-
230
-
231
-
232
-
233
-
234
-
235
-
236
-
237
-
238
-
239
-
240
-
241
-
242
-
243
-
244
-
245
-
246
-
247
-
248
-
249
-
250
-
251
-
252
-
253
-
254
-
255
-
256
-
257
-
258
-
259
-
260
-
261
-
262
-
263
-
264
-
265
-
266
-
267
-
268
-
269
-
270
-
271
-
272
-
273
-
274
-
275
-
276
-
277
-
278
-
279
-
280
-
281
-
282
-
283
-
284
-
285
 |
 |

NOTES TO CONSOLIDATED FINANCIAL STATEMENTS (Continued)
10. SHAREHOLDERS' EQUITY (Continued)
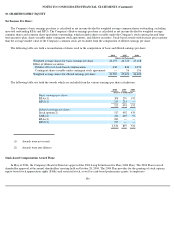
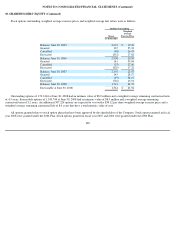
Using the fair value of each grant on the date of grant, the weighted average fair values per stock-based compensation award granted during
fiscal years 2008, 2007 and 2006 were as follows:
The expense associated with the RSA and RSU grants is based on the market price of the Company's stock at the date of grant. The
significant assumptions used in determining the underlying fair value on the date of grant of each stock option and SAR grant issued during the
fiscal years 2008, 2007 and 2006 is presented below:
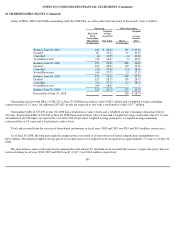
The risk free rate of return is determined based on the U.S. Treasury rates approximating the expected life of the options and SARs granted.
Expected volatility is established based on historical volatility of the Company's stock price. Estimated expected life was based on an analysis of
historical stock options granted data which included analyzing grant activity including grants exercised, expired, and canceled. The expected
dividend yield is determined based on the Company's annual dividend amount as a percentage of the strike price at the time of the grant. The
Company uses historical data to estimate pre-vesting forfeiture rates.
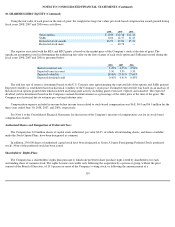
Compensation expense included in income before income taxes related to stock-
based compensation was $6.8, $4.9 and $4.9 million for the
three years ended June 30, 2008, 2007, and 2006, respectively.
See Note 1 to the Consolidated Financial Statements for discussion of the Company's measure of compensation cost for its stock-based
compensation awards.
Authorized Shares and Designation of Preferred Class:
The Company has 100 million shares of capital stock authorized, par value $0.05, of which all outstanding shares, and shares available
under the Stock Option Plans, have been designated as common.
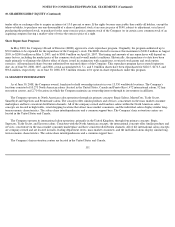
In addition, 250,000 shares of authorized capital stock have been designated as Series A Junior Participating Preferred Stock (preferred
stock). None of the preferred stock has been issued.
Shareholders' Rights Plan:
The Company has a shareholders' rights plan pursuant to which one preferred share purchase right is held by shareholders for each
outstanding share of common stock. The rights become exercisable only following the acquisition by a person or group, without the prior
consent of the Board of Directors, of 15.0 percent or more of the Company's voting stock, or following the announcement of a
110
2008
2007
2006
Stock options
$
8.60
$
12.38
$
11.43
SARs
8.60
12.37
11.43
Restricted stock awards
28.57
39.01
35.33
Restricted stock units
—
40.70
—
2008
2007
2006
Risk
-
free interest rate
3.29
%
4.55
%
4.96
%
Expected term (in years)
5.50
5.50
5.50
Expected volatility
28.00
%
27.00
%
27.00
%
Expected dividend yield
0.56
%
0.41
%
0.45
%