Supercuts 2008 Annual Report Download - page 46
Download and view the complete annual report
Please find page 46 of the 2008 Supercuts annual report below. You can navigate through the pages in the report by either clicking on the pages listed below, or by using the keyword search tool below to find specific information within the annual report.-
 1
1 -
2
-
3
-
4
-
5
-
6
-
7
-
8
-
9
-
10
-
11
-
12
-
13
-
14
-
15
-
16
-
17
-
18
-
19
-
20
-
21
-
22
-
23
-
24
-
25
-
26
-
27
-
28
-
29
-
30
-
31
-
32
-
33
-
34
-
35
-
 36
36 -
 37
37 -
 38
38 -
 39
39 -
 40
40 -
 41
41 -
 42
42 -
 43
43 -
 44
44 -
 45
45 -
 46
46 -
 47
47 -
 48
48 -
 49
49 -
 50
50 -
 51
51 -
 52
52 -
 53
53 -
 54
54 -
 55
55 -
 56
56 -
57
-
58
-
59
-
60
-
61
-
62
-
63
-
64
-
65
-
66
-
67
-
68
-
69
-
70
-
71
-
72
-
73
-
74
-
75
-
76
-
77
-
78
-
79
-
80
-
81
-
82
-
83
-
84
-
85
-
86
-
87
-
88
-
89
-
90
-
91
-
92
-
93
-
94
-
95
-
96
-
97
-
98
-
99
-
100
-
101
-
102
-
103
-
104
-
105
-
106
-
107
-
108
-
109
-
110
-
111
-
112
-
113
-
114
-
115
-
116
-
117
-
118
-
119
-
120
-
121
-
122
-
123
-
124
-
125
-
126
-
127
-
128
-
129
-
130
-
131
-
132
-
133
-
134
-
135
-
136
-
137
-
138
-
139
-
140
-
141
-
142
-
143
-
144
-
145
-
146
-
147
-
148
-
149
-
150
-
151
-
152
-
153
-
154
-
155
-
156
-
157
-
158
-
159
-
160
-
161
-
162
-
163
-
164
-
165
-
166
-
167
-
168
-
169
-
170
-
171
-
172
-
173
-
174
-
175
-
176
-
177
-
178
-
179
-
180
-
181
-
182
-
183
-
184
-
185
-
186
-
187
-
188
-
189
-
190
-
191
-
192
-
193
-
194
-
195
-
196
-
197
-
198
-
199
-
200
-
201
-
202
-
203
-
204
-
205
-
206
-
207
-
208
-
209
-
210
-
211
-
212
-
213
-
214
-
215
-
216
-
217
-
218
-
219
-
220
-
221
-
222
-
223
-
224
-
225
-
226
-
227
-
228
-
229
-
230
-
231
-
232
-
233
-
234
-
235
-
236
-
237
-
238
-
239
-
240
-
241
-
242
-
243
-
244
-
245
-
246
-
247
-
248
-
249
-
250
-
251
-
252
-
253
-
254
-
255
-
256
-
257
-
258
-
259
-
260
-
261
-
262
-
263
-
264
-
265
-
266
-
267
-
268
-
269
-
270
-
271
-
272
-
273
-
274
-
275
-
276
-
277
-
278
-
279
-
280
-
281
-
282
-
283
-
284
-
285
 |
 |

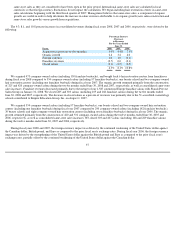
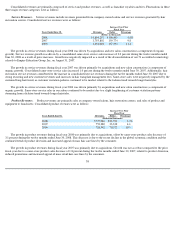
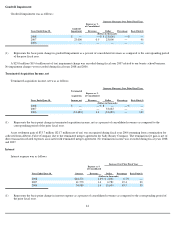
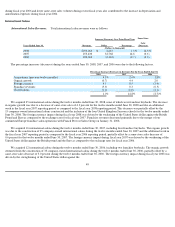
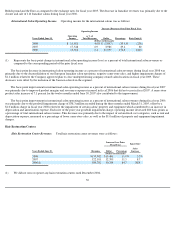
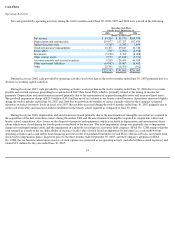
Goodwill Impairment
Goodwill impairment was as follows:
(1)
Increase (Decrease) Over Prior Fiscal Year
Years Ended June 30,
Goodwill
Impairment
Expense as %
of Consolidated
Revenues
Dollar
Percentage
Basis Point(1)
(Dollars in thousands)
2008
$
—
—
%
$
(
23,000
)
—
%
—
2007
23,000
0.9
23,000
—
90
2006
—
—
—
—
—
Represents the basis point change in goodwill impairment as a percent of consolidated revenues as compared to the corresponding period
of the prior fiscal year.
A $23.0 million ($19.6 million net of tax) impairment charge was recorded during fiscal year 2007 related to our beauty school business.
No impairment charges were recorded during fiscal years 2008 and 2006.
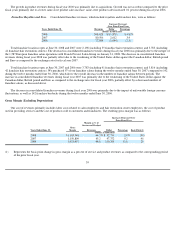
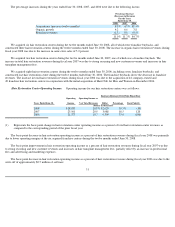
Terminated Acquisition Income, net
Terminated acquisition income, net was as follows:
(1)
Increase (Decrease) Over Prior Fiscal Year
Years Ended June 30,
Terminated
Acquisition
Income, net
Expense as %
of Consolidated
Revenues
Dollar
Percentage
Basis Point(1)
(Dollars in thousands)
2008
$
—
—
%
$
—
—
%
—
2007
—
—
33,683
—
—
2006
(33,683
)
1.4
(33,683
)
—
140
Represents the basis point change in terminated acquisition income, net as a percent of consolidated revenues as compared to the
corresponding period of the prior fiscal year.
A net settlement gain of $33.7 million ($21.7 million net of tax) was recognized during fiscal year 2006 stemming from a termination fee
collected from Alberto-Culver Company due to the terminated merger agreement for Sally Beauty Company. The termination fee gain is net of
direct transaction related expenses associated with terminated merger agreement. No termination income was recorded during fiscal years 2008
and 2007.
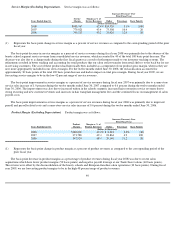
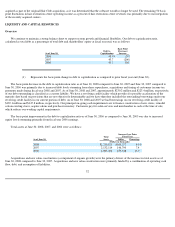
Interest
Interest expense was as follows:
(1)
Increase Over Prior Fiscal Year
Years Ended June 30,
Interest
Expense as %
of Consolidated
Revenues
Dollar
Percentage
Basis Point(1)
(Dollars in thousands)
2008
$
44,571
1.6
%
$
2,801
6.7
%
—
2007
41,770
1.6
6,781
19.4
20
2006
34,989
1.4
10,604
43.5
30
Represents the basis point change in interest expense as a percent of consolidated revenues as compared to the corresponding period of
the prior fiscal year.
44