Supercuts 2008 Annual Report Download - page 114
Download and view the complete annual report
Please find page 114 of the 2008 Supercuts annual report below. You can navigate through the pages in the report by either clicking on the pages listed below, or by using the keyword search tool below to find specific information within the annual report.-
 1
1 -
2
-
3
-
4
-
5
-
6
-
7
-
8
-
9
-
10
-
11
-
12
-
13
-
14
-
15
-
16
-
17
-
18
-
19
-
20
-
21
-
22
-
23
-
24
-
25
-
26
-
27
-
28
-
29
-
30
-
31
-
32
-
33
-
34
-
35
-
36
-
37
-
38
-
39
-
40
-
41
-
42
-
43
-
44
-
45
-
46
-
47
-
48
-
49
-
50
-
51
-
52
-
53
-
54
-
55
-
56
-
57
-
58
-
59
-
60
-
61
-
62
-
63
-
64
-
65
-
66
-
67
-
68
-
69
-
70
-
71
-
72
-
73
-
74
-
75
-
76
-
77
-
78
-
79
-
80
-
81
-
82
-
83
-
84
-
85
-
86
-
87
-
88
-
89
-
90
-
91
-
92
-
93
-
94
-
95
-
96
-
97
-
98
-
99
-
100
-
101
-
102
-
103
-
 104
104 -
 105
105 -
 106
106 -
 107
107 -
 108
108 -
 109
109 -
 110
110 -
 111
111 -
 112
112 -
 113
113 -
 114
114 -
 115
115 -
 116
116 -
 117
117 -
 118
118 -
 119
119 -
 120
120 -
 121
121 -
 122
122 -
 123
123 -
 124
124 -
125
-
126
-
127
-
128
-
129
-
130
-
131
-
132
-
133
-
134
-
135
-
136
-
137
-
138
-
139
-
140
-
141
-
142
-
143
-
144
-
145
-
146
-
147
-
148
-
149
-
150
-
151
-
152
-
153
-
154
-
155
-
156
-
157
-
158
-
159
-
160
-
161
-
162
-
163
-
164
-
165
-
166
-
167
-
168
-
169
-
170
-
171
-
172
-
173
-
174
-
175
-
176
-
177
-
178
-
179
-
180
-
181
-
182
-
183
-
184
-
185
-
186
-
187
-
188
-
189
-
190
-
191
-
192
-
193
-
194
-
195
-
196
-
197
-
198
-
199
-
200
-
201
-
202
-
203
-
204
-
205
-
206
-
207
-
208
-
209
-
210
-
211
-
212
-
213
-
214
-
215
-
216
-
217
-
218
-
219
-
220
-
221
-
222
-
223
-
224
-
225
-
226
-
227
-
228
-
229
-
230
-
231
-
232
-
233
-
234
-
235
-
236
-
237
-
238
-
239
-
240
-
241
-
242
-
243
-
244
-
245
-
246
-
247
-
248
-
249
-
250
-
251
-
252
-
253
-
254
-
255
-
256
-
257
-
258
-
259
-
260
-
261
-
262
-
263
-
264
-
265
-
266
-
267
-
268
-
269
-
270
-
271
-
272
-
273
-
274
-
275
-
276
-
277
-
278
-
279
-
280
-
281
-
282
-
283
-
284
-
285
 |
 |

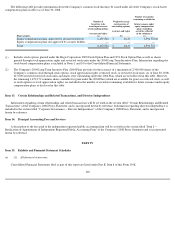
NOTES TO CONSOLIDATED FINANCIAL STATEMENTS (Continued)
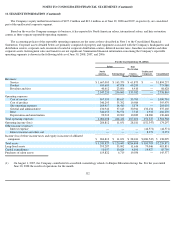
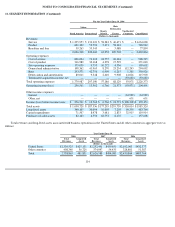
11. SEGMENT INFORMATION (Continued)
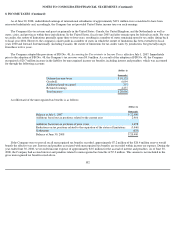
The Company's equity method investments of $197.9 million and $12.1 million as of June 30, 2008 and 2007, respectively, are considered
part of the unallocated corporate segment.
Based on the way the Company manages its business, it has reported its North American salons, international salons, and hair restoration
centers as three separate reportable operating segments.
The accounting policies of the reportable operating segments are the same as those described in Note 1 to the Consolidated Financial
Statements. Corporate assets detailed below are primarily comprised of property and equipment associated with the Company's headquarters and
distribution centers, corporate cash, inventories located at corporate distribution centers, deferred income taxes, franchise receivables and other
corporate assets. Intersegment sales and transfers are not significant. Summarized financial information concerning the Company's reportable
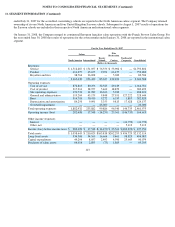
operating segments is shown in the following table as of June 30, 2008, 2007, and 2006:
(1)
For the Year Ended June 30, 2008(1)
Salons
Hair
Restoration
Centers
Unallocated
Corporate
North
America
International
Consolidated
(Dollars in thousands)
Revenues:
Service
$
1,667,005
$
165,379
$
61,873
$
—
$
1,894,257
Product
639,603
67,078
69,299
—
775,980
Royalties and fees
40,612
23,606
4,410
—
68,628
2,347,220
256,063
135,582
—
2,738,865
Operating expenses:
Cost of service
967,393
89,617
33,700
—
1,090,710
Cost of product
340,293
35,702
19,984
—
395,979
Site operating expenses
184,417
14,410
5,174
—
204,001
General and administrative
136,942
37,143
30,941
132,134
337,160
Rent
340,453
56,571
7,313
1,933
406,270
Depreciation and amortization
90,910
10,969
10,289
18,280
130,448
Total operating expenses
2,060,408
244,412
107,401
152,347
2,564,568
Operating income (loss)
286,812
11,651
28,181
(152,347
)
174,297
Other income (expense):
Interest expense
—
—
—
(
44,571
)
(44,571
)
Interest income and other, net
—
—
—
8,373
8,373
Income (loss) before income taxes and equity in income of affiliated
companies
$
286,812
$
11,651
$
28,181
$
(188,545
)
$
138,099
Total assets
$
1,249,827
$
120,443
$
284,898
$
580,703
$
2,235,871
Long
-
lived assets
355,287
35,902
11,616
79,046
481,851
Capital expenditures
51,057
10,624
4,191
19,927
85,799
Purchases of salon assets
119,822
6,719
19,036
—
145,577
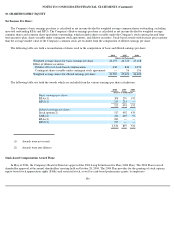
On August 1, 2007, the Company contributed its accredited cosmetology schools to Empire Education Group, Inc. For the year ended
June 30, 2008 the results of operations for the month
112