Shutterfly 2007 Annual Report Download - page 46
Download and view the complete annual report
Please find page 46 of the 2007 Shutterfly annual report below. You can navigate through the pages in the report by either clicking on the pages listed below, or by using the keyword search tool below to find specific information within the annual report.-
 1
1 -
2
-
3
-
4
-
5
-
6
-
7
-
8
-
9
-
10
-
11
-
12
-
13
-
14
-
15
-
16
-
17
-
18
-
19
-
20
-
21
-
22
-
23
-
24
-
25
-
26
-
27
-
28
-
29
-
30
-
31
-
32
-
33
-
34
-
35
-
 36
36 -
 37
37 -
 38
38 -
 39
39 -
 40
40 -
 41
41 -
 42
42 -
 43
43 -
 44
44 -
 45
45 -
 46
46 -
 47
47 -
 48
48 -
 49
49 -
 50
50 -
 51
51 -
 52
52 -
 53
53 -
 54
54 -
 55
55 -
 56
56 -
57
-
58
-
59
-
60
-
61
-
62
-
63
-
64
-
65
-
66
-
67
-
68
-
69
-
70
-
71
-
72
-
73
-
74
-
75
-
76
-
77
-
78
-
79
-
80
-
81
-
82
-
83
-
84
-
85
-
86
-
87
-
88
-
89
-
90
-
91
-
92
-
93
-
94
-
95
-
96
-
97
-
98
-
99
-
100
-
101
-
102
-
103
-
104
-
105
-
106
-
107
-
108
-
109
-
110
-
111
-
112
-
113
-
114
-
115
-
116
-
117
-
118
-
119
-
120
-
121
-
122
-
123
-
124
-
125
 |
 |

Table of Contents
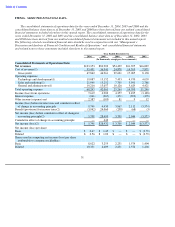
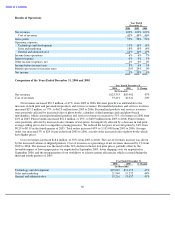
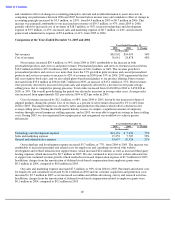
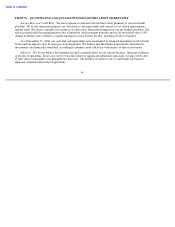
Our general and administrative expense increased by $3.5 million, or 35%, from 2004 to 2005. Personnel and
related costs increased by $0.8 million and legal and accounting costs increased $0.5 million over 2004 expenditures.
Recruiting costs increased by $0.5 million due to increased hiring and depreciation increased $0.2 million related to
our information technology equipment from 2004 to 2005. In addition, charges from the amortization of deferred
stock-based compensation related to employee grants were $1.8 million in 2004, compared to $2.2 million in 2005.
Payment processing fees paid to third parties also increased by $0.9 million in 2005 due to increased order volumes.
Interest expense decreased by $0.1 million, or 22%, from 2004 to 2005, due to the repayment of a loan from
Monaco Partners, L.P., which is controlled by James Clark, a former member of our board of directors, in 2004.
Interest expense in 2005 also included amounts representing interest expense on capitalized lease obligations and
interest expense and related loan fees for a term loan entered into and repaid during 2005.
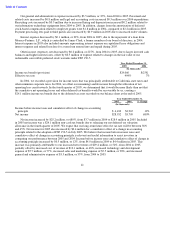
Other income (expense), net decreased by $0.2 million, or 227%, from 2004 to 2005, due to larger invested cash
balances and higher interest rates, offset by $0.5 million of expense related to changes in the fair value of our
redeemable convertible preferred stock warrants under FSP 150-5.
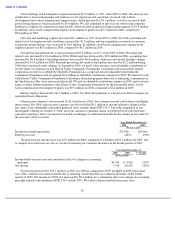
In 2004, we recorded a provision for income taxes that was principally attributable to California state taxes and
other minimum corporate taxes. In 2004, we offset our remaining taxable income through the utilization of net
operating loss carryforwards. In the fourth quarter of 2005, we determined that it would be more likely than not that
the cumulative net operating losses and other deferred tax benefits would be recoverable by us, creating a
$24.1 million income tax benefit due to the deferred tax asset recorded on our balance sheet at the end of 2005.
Net income increased by $25.2 million, or 680%, from $3.7 million in 2004 to $28.9 million in 2005. Included
in 2005 net income was a $24.1 million non-cash tax benefit due to releasing our net deferred tax valuation
allowance in the fourth quarter of 2005. We expect that our long-term future effective tax rate will be between 38%
and 45%. Net income for 2005 also increased by $0.4 million for a cumulative effect of a change in accounting
principle related to the adoption of FSP 150-5 in July 2005. We believe that income before income taxes and
cumulative effect of change in accounting principle is relevant and useful information to assist investors in
comparing our performance between 2005 and 2004. Income before income taxes and cumulative effect of change in
accounting principle increased by $0.5 million, or 12%, from $4.0 million in 2004 to $4.4 million in 2005. This
increase was primarily attributable to our increased net revenues of $29.4 million, or 54%, from 2004 to 2005,
partially offset by increased cost of revenue of $12.1 million, or 48%, increased technology and development
expense of $5.7 million, or 77%, increased sales and marketing expense of $7.5 million, or 98%, and increased
general and administrative expense of $3.5 million, or 35%, from 2004 to 2005.
41
Year Ended December 31,
2005
2004
(In thousands)
Income tax benefit (provision)
$
24,060
$
(258
)
Effective tax rate
494
%
7
%
Year Ended December 31,
2005
2004
% Change
(In thousands)
Income before income taxes and cumulative effect of change in accounting
principle
$
4,430
$
3,967
12
%
Net income
$
28,932
$
3,709
680
%