Shutterfly 2007 Annual Report Download - page 45
Download and view the complete annual report
Please find page 45 of the 2007 Shutterfly annual report below. You can navigate through the pages in the report by either clicking on the pages listed below, or by using the keyword search tool below to find specific information within the annual report.-
 1
1 -
2
-
3
-
4
-
5
-
6
-
7
-
8
-
9
-
10
-
11
-
12
-
13
-
14
-
15
-
16
-
17
-
18
-
19
-
20
-
21
-
22
-
23
-
24
-
25
-
26
-
27
-
28
-
29
-
30
-
31
-
32
-
33
-
34
-
 35
35 -
 36
36 -
 37
37 -
 38
38 -
 39
39 -
 40
40 -
 41
41 -
 42
42 -
 43
43 -
 44
44 -
 45
45 -
 46
46 -
 47
47 -
 48
48 -
 49
49 -
 50
50 -
 51
51 -
 52
52 -
 53
53 -
 54
54 -
 55
55 -
56
-
57
-
58
-
59
-
60
-
61
-
62
-
63
-
64
-
65
-
66
-
67
-
68
-
69
-
70
-
71
-
72
-
73
-
74
-
75
-
76
-
77
-
78
-
79
-
80
-
81
-
82
-
83
-
84
-
85
-
86
-
87
-
88
-
89
-
90
-
91
-
92
-
93
-
94
-
95
-
96
-
97
-
98
-
99
-
100
-
101
-
102
-
103
-
104
-
105
-
106
-
107
-
108
-
109
-
110
-
111
-
112
-
113
-
114
-
115
-
116
-
117
-
118
-
119
-
120
-
121
-
122
-
123
-
124
-
125
 |
 |

Table of Contents
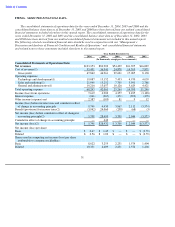
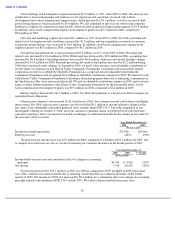
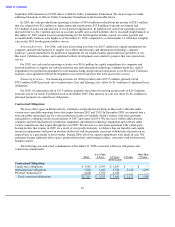
and cumulative effect of change in accounting principle is relevant and useful information to assist investors in
comparing our performance between 2006 and 2005. Income before income taxes and cumulative effect of change in
accounting principle increased by $5.3 million, or 120%, from $4.4 million in 2005 to $9.7 million in 2006. This
increase was primarily attributable to our increased net revenues of $39.5 million, or 47%, from 2005 to 2006,
partially offset by increased cost of revenues of $18.5 million, or 50%, increased technology and development
expense of $5.9 million, or 45%, increased sales and marketing expense of $6.7 million, or 44%, and increased
general and administrative expense of $5.6 million, or 41%, from 2005 to 2006.
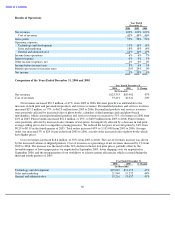
Comparison of the Years Ended December 31, 2005 and 2004
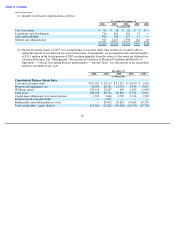
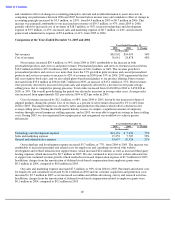
Net revenues increased $29.4 million, or 54%, from 2004 to 2005, attributable to the increase in both
personalized products and services and print revenues. Personalized products and services revenues increased from
$18.9 million in 2004 to $35.2 million in 2005, an increase of $16.3 million, or 86%. The revenue growth for
personalized products and services was more than twice the 37% growth in print revenues and caused personalized
products and services revenues to increase to 42% of revenues in 2005 from 35% in 2004. 2005 represented the first
full year of photo book sales, and we also added photo-based merchandise to our product offering. Print revenues
increased from $35.6 million in 2004 to $48.7 million in 2005, an increase of $13.1 million or 37%. Print revenues
were positively affected by increased 4×6 print sales and negatively affected by a decrease in 4×6 print average
selling prices due to competitive pricing pressures. Total orders increased from 2,618,000 in 2004 to 3,650,000 in
2005, or 39%. The overall growth during the period was driven by increases in average order sizes. Average order
size increased from approximately $21 per order in 2004 to $23 per order in 2005.
Cost of revenues increased by $12.1 million, or 48%, from 2004 to 2005, driven by the increased volume of
shipped products during this period. Cost of revenues as a percent of net revenues decreased by 2% to 44% from
2004 to 2005. This improvement was driven by labor and production efficiencies which offset a decline in 4×6
average selling prices. During the fourth quarter holiday season, we employ a significant amount of temporary
workers through several temporary staffing agencies, and in 2005, we were able to negotiate savings in these staffing
costs. During 2005, we also negotiated lower paper prices and reorganized our workflows to achieve greater
efficiencies.
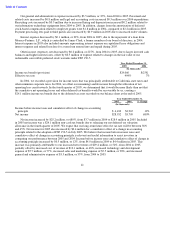
Our technology and development expense increased $5.7 million, or 77%, from 2004 to 2005. The increase was
attributable to increased personnel and related costs for employees and consultants involved with website
development and website infrastructure support teams, which increased $2.4 million, as well as increased third-party
hosting expenses which increased by $0.7 million in 2005. We also continued to invest in our website infrastructure
to support our continued revenue growth, which resulted in increased depreciation expense of $1.5 million for 2005.
In addition, charges from the amortization of deferred stock-based compensation from employee grants were
$0.3 million in 2004, compared to $0.8 million in 2005.
Our sales and marketing expense increased $7.5 million, or 98%, from 2004 to 2005. Personnel and related costs
for employees and consultants increased by $1.6 million in 2005 and our customer acquisition and promotion costs
increased by $5.7 million in 2005 as we increased our online and offline advertising, survey and research activities.
In addition, charges from the amortization of deferred stock-based compensation related to employee grants were
$0.1 million in 2004, compared to $0.2 million in 2005.
40
Year Ended December 31,
2005
2004
% Change
(In thousands)
Net revenues
$
83,902
$
54,499
54
%
Cost of revenues
36,941
24,878
48
%
Year Ended December 31,
2005
2004
% Change
(In thousands)
Technology and development expense
$
13,152
$
7,433
77
%
Sales and marketing expense
15,252
7,705
98
%
General and administrative expense
13,657
10,126
35
%