Shutterfly 2007 Annual Report Download - page 43
Download and view the complete annual report
Please find page 43 of the 2007 Shutterfly annual report below. You can navigate through the pages in the report by either clicking on the pages listed below, or by using the keyword search tool below to find specific information within the annual report.-
 1
1 -
2
-
3
-
4
-
5
-
6
-
7
-
8
-
9
-
10
-
11
-
12
-
13
-
14
-
15
-
16
-
17
-
18
-
19
-
20
-
21
-
22
-
23
-
24
-
25
-
26
-
27
-
28
-
29
-
30
-
31
-
32
-
 33
33 -
 34
34 -
 35
35 -
 36
36 -
 37
37 -
 38
38 -
 39
39 -
 40
40 -
 41
41 -
 42
42 -
 43
43 -
 44
44 -
 45
45 -
 46
46 -
 47
47 -
 48
48 -
 49
49 -
 50
50 -
 51
51 -
 52
52 -
 53
53 -
54
-
55
-
56
-
57
-
58
-
59
-
60
-
61
-
62
-
63
-
64
-
65
-
66
-
67
-
68
-
69
-
70
-
71
-
72
-
73
-
74
-
75
-
76
-
77
-
78
-
79
-
80
-
81
-
82
-
83
-
84
-
85
-
86
-
87
-
88
-
89
-
90
-
91
-
92
-
93
-
94
-
95
-
96
-
97
-
98
-
99
-
100
-
101
-
102
-
103
-
104
-
105
-
106
-
107
-
108
-
109
-
110
-
111
-
112
-
113
-
114
-
115
-
116
-
117
-
118
-
119
-
120
-
121
-
122
-
123
-
124
-
125
 |
 |

Table of Contents
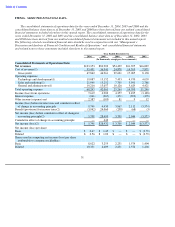
Results of Operations
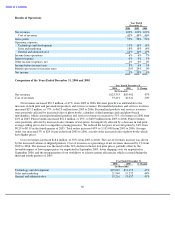
Comparison of the Years Ended December 31, 2006 and 2005
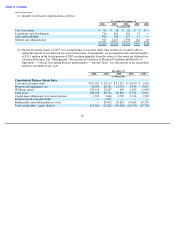
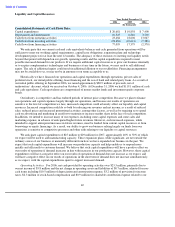
Net revenues increased $39.5 million, or 47%, from 2005 to 2006. Revenue growth was attributable to the
increases in both print and personalized products and services revenues. Personalized products and services revenues
increased $27.2 million, or 77%, to $62.4 million from 2005 to 2006. Personalized products and services revenues
were positively affected by increased sales of photo books, calendars, folded greeting cards and photo-based
merchandise, which caused personalized products and services revenues to increase to 51% of revenues in 2006 from
42% in 2005. Print revenues increased $12.2 million, or 25%, to $60.9 million from 2005 to 2006. Print revenues
were positively affected by increased sales volumes of 4x6 prints, but negatively affected by a decrease in 4x6 print
average selling prices due to competitive pricing pressures. We reduced the list price of our 4x6 prints by 34% from
$0.29 to $0.19 in the fourth quarter of 2005. Total orders increased 40% to 5,105,000 from 2005 to 2006. Average
order size increased 5% to $24.16 per order from 2005 to 2006, a result of the increased sales of photo books which
have higher prices.
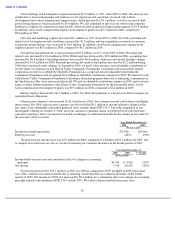
Cost of revenues increased $18.6 million, or 50%, from 2005 to 2006. The cost of revenues increase was driven
by the increased volume of shipped products. Cost of revenues as a percentage of net revenues increased by 1% from
2005 to 2006. The increase was the result of the 34% decline in the list 4x6 print prices, partially offset by the
favorable impact of lower paper prices we negotiated in September 2005, lower shipping costs we negotiated in
September 2006, and the reorganization of our workflows to achieve greater efficiencies which occurred during the
third and fourth quarters of 2005.
38
Year Ended
December 31,
2006
2005
2004
Net revenues
100
%
100
%
100
%
Cost of revenues
45
%
44
%
46
%
Gross profit
55
%
56
%
54
%
Operating expenses:
Technology and development
15
%
16
%
14
%
Sales and marketing
18
%
18
%
14
%
General and administrative
16
%
16
%
19
%
Income from operations
6
%
6
%
7
%
Interest expense
0
%
0
%
1
%
Other income (expense), net
2
%
0
%
0
%
Income before income taxes
8
%
6
%
6
%
Benefit (provision) for income taxes
(3
)%
29
%
0
%
Net income
5
%
35
%
6
%
Year Ended December 31,
2006
2005
% Change
(In thousands)
Net revenues
$
123,353
$
83,902
47
%
Cost of revenues
55,491
36,941
50
%
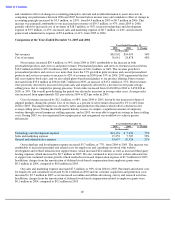
Year Ended December 31,
2006
2005
% Change
(In thousands)
Technology and development
$
19,087
$
13,152
45
%
Sales and marketing
21,940
15,252
44
%
General and administrative
19,216
13,657
41
%