Shutterfly 2007 Annual Report Download - page 37
Download and view the complete annual report
Please find page 37 of the 2007 Shutterfly annual report below. You can navigate through the pages in the report by either clicking on the pages listed below, or by using the keyword search tool below to find specific information within the annual report.-
 1
1 -
2
-
3
-
4
-
5
-
6
-
7
-
8
-
9
-
10
-
11
-
12
-
13
-
14
-
15
-
16
-
17
-
18
-
19
-
20
-
21
-
22
-
23
-
24
-
25
-
26
-
 27
27 -
 28
28 -
 29
29 -
 30
30 -
 31
31 -
 32
32 -
 33
33 -
 34
34 -
 35
35 -
 36
36 -
 37
37 -
 38
38 -
 39
39 -
 40
40 -
 41
41 -
 42
42 -
 43
43 -
 44
44 -
 45
45 -
 46
46 -
 47
47 -
48
-
49
-
50
-
51
-
52
-
53
-
54
-
55
-
56
-
57
-
58
-
59
-
60
-
61
-
62
-
63
-
64
-
65
-
66
-
67
-
68
-
69
-
70
-
71
-
72
-
73
-
74
-
75
-
76
-
77
-
78
-
79
-
80
-
81
-
82
-
83
-
84
-
85
-
86
-
87
-
88
-
89
-
90
-
91
-
92
-
93
-
94
-
95
-
96
-
97
-
98
-
99
-
100
-
101
-
102
-
103
-
104
-
105
-
106
-
107
-
108
-
109
-
110
-
111
-
112
-
113
-
114
-
115
-
116
-
117
-
118
-
119
-
120
-
121
-
122
-
123
-
124
-
125
 |
 |

Table of Contents
32
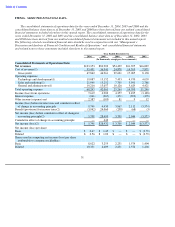
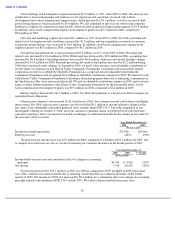
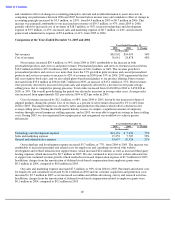
(1)
Includes stock
-
based compensation as follows:
Year Ended December 31,
2006
2005
2004
2003
2002
(In thousands)
Cost of revenues
$
96
$
28
$
21
$
3
$
—
Technology and development
736
826
263
32
—
Sales and marketing
521
239
117
11
—
General and administration
947
2,217
1,790
124
20
$
2,300
$
3,310
$
2,191
$
170
$
20
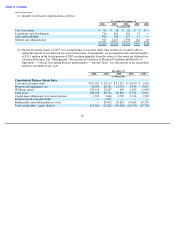
(2)
During the fourth quarter of 2005, we concluded that it was more likely than not that we would be able to
realize the benefit of our deferred tax assets in the future. Consequently, we recognized a non-cash tax benefit
of $24.1 million in the fourth quarter of 2005 resulting primarily from the release of the entire net deferred tax
valuation allowance. See “Management’s Discussion and Analysis of Financial Condition and Results of
Operations — Critical Accounting Policies and Estimates — Income Taxes” for a discussion of the uncertainty
related to our deferred tax asset.
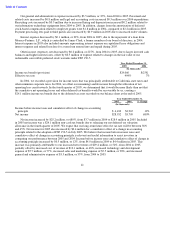
December 31,
2006
2005
2004
2003
2002
(In thousands)
Consolidated Balance Sheets Data:
Cash and cash equivalents
$
119,051
$
39,153
$
13,781
$
10,670
$
3,658
Property and equipment, net
30,919
20,761
11,723
5,140
3,617
Working capital
102,165
22,687
690
2,002
(1,050
)
Total assets
180,160
89,552
29,865
17,754
8,831
Capital lease obligations, less current portion
1,742
3,646
2,709
1,314
1,292
Preferred stock warrant liability
—
1,535
—
—
—
Redeemable convertible preferred stock
—
89,652
69,822
69,668
69,230
Total stockholders
’
equity (deficit)
151,326
(27,262
)
(59,568
)
(65,333
)
(67,752
)