Seagate 2002 Annual Report Download - page 67
Download and view the complete annual report
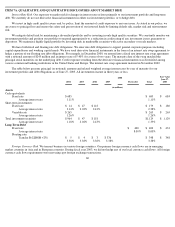
Please find page 67 of the 2002 Seagate annual report below. You can navigate through the pages in the report by either clicking on the pages listed below, or by using the keyword search tool below to find specific information within the annual report.-
 1
1 -
2
-
3
-
4
-
5
-
6
-
7
-
8
-
9
-
10
-
11
-
12
-
13
-
14
-
15
-
16
-
17
-
18
-
19
-
20
-
21
-
22
-
23
-
24
-
25
-
26
-
27
-
28
-
29
-
30
-
31
-
32
-
33
-
34
-
35
-
36
-
37
-
38
-
39
-
40
-
41
-
42
-
43
-
44
-
45
-
46
-
47
-
48
-
49
-
50
-
51
-
52
-
53
-
54
-
55
-
56
-
 57
57 -
 58
58 -
 59
59 -
 60
60 -
 61
61 -
 62
62 -
 63
63 -
 64
64 -
 65
65 -
 66
66 -
 67
67 -
 68
68 -
 69
69 -
 70
70 -
 71
71 -
 72
72 -
 73
73 -
 74
74 -
 75
75 -
 76
76 -
 77
77 -
78
-
79
-
80
-
81
-
82
-
83
-
84
-
85
-
86
-
87
-
88
-
89
-
90
-
91
-
92
-
93
-
94
-
95
-
96
-
97
-
98
-
99
-
100
-
101
-
102
-
103
-
104
-
105
-
106
-
107
-
108
-
109
-
110
-
111
-
112
-
113
-
114
-
115
-
116
-
117
-
118
-
119
-
120
-
121
-
122
-
123
-
124
 |
 |

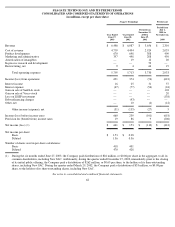
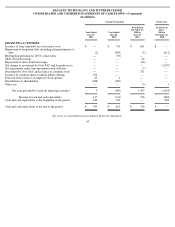
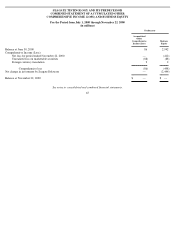
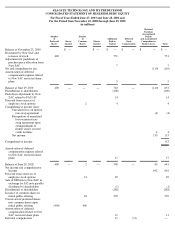
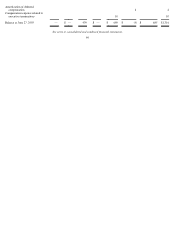
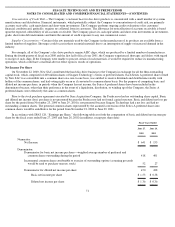
SEAGATE TECHNOLOGY AND ITS PREDECESSOR
CONSOLIDATED AND COMBINED STATEMENTS OF OPERATIONS
(in millions, except per share data)
See notes to consolidated and combined financial statements.
62
Seagate Technology
Predecessor
Year Ended
June 27,
2003
Year Ended
June 28,
2002
Period from
November 23,
2000 to
June 29,
2001
Period from
July 1,
2000 to
November 22,
2000
Revenue
$
6,486
$
6,087
$
3,656
$
2,310
Cost of revenue
4,759
4,494
2,924
2,035
Product development
670
698
388
409
Marketing and administrative
357
498
288
450
Amortization of intangibles
—
19
12
20
In
-
process research and development
—
—
52
—
Restructuring, net
9
4
66
19
Total operating expenses
5,795
5,713
3,730
2,933
Income (loss) from operations
691
374
(74
)
(623
)
Interest income
16
25
31
57
Interest expense
(47
)
(77
)
(54
)
(24
)
Gain on sale of SanDisk stock
—
—
—
102
Gain on sale of Veeco stock
—
—
—
20
Loss on LHSP investment
—
—
—
(
138
)
Debt refinancing charges
—
(
93
)
—
—
Other, net
—
10
(4
)
(12
)
Other income (expense), net
(31
)
(135
)
(27
)
5
Income (loss) before income taxes
660
239
(101
)
(618
)
Provision for (benefit from) income taxes
19
86
9
(206
)
Net income (loss) (1)
$
641
$
153
$
(110
)
$
(412
)
Net income per share:
Basic
$
1.53
$
0.38
Diluted
1.36
0.36
Number of shares used in per share calculations:
Basic
418
401
Diluted
470
428
(1)
During the six months ended June 27, 2003, the Company paid distributions of $26 million, or $0.06 per share in the aggregate, to all its
common shareholders, including New SAC. Additionally, during the quarter ended December 27, 2002, immediately prior to the closing
of its initial public offering, the Company paid a distribution of $262 million, or $0.65 per share, to the holders of its then-outstanding
shares, including New SAC. During the quarter ended March 29, 2002, the Company paid a distribution of $33 million, or $0.08 per
share, to the holders of its then
-
outstanding shares, including New SAC.