Seagate 2002 Annual Report Download - page 37
Download and view the complete annual report
Please find page 37 of the 2002 Seagate annual report below. You can navigate through the pages in the report by either clicking on the pages listed below, or by using the keyword search tool below to find specific information within the annual report.-
 1
1 -
2
-
3
-
4
-
5
-
6
-
7
-
8
-
9
-
10
-
11
-
12
-
13
-
14
-
15
-
16
-
17
-
18
-
19
-
20
-
21
-
22
-
23
-
24
-
25
-
26
-
 27
27 -
 28
28 -
 29
29 -
 30
30 -
 31
31 -
 32
32 -
 33
33 -
 34
34 -
 35
35 -
 36
36 -
 37
37 -
 38
38 -
 39
39 -
 40
40 -
 41
41 -
 42
42 -
 43
43 -
 44
44 -
 45
45 -
 46
46 -
 47
47 -
48
-
49
-
50
-
51
-
52
-
53
-
54
-
55
-
56
-
57
-
58
-
59
-
60
-
61
-
62
-
63
-
64
-
65
-
66
-
67
-
68
-
69
-
70
-
71
-
72
-
73
-
74
-
75
-
76
-
77
-
78
-
79
-
80
-
81
-
82
-
83
-
84
-
85
-
86
-
87
-
88
-
89
-
90
-
91
-
92
-
93
-
94
-
95
-
96
-
97
-
98
-
99
-
100
-
101
-
102
-
103
-
104
-
105
-
106
-
107
-
108
-
109
-
110
-
111
-
112
-
113
-
114
-
115
-
116
-
117
-
118
-
119
-
120
-
121
-
122
-
123
-
124
 |
 |

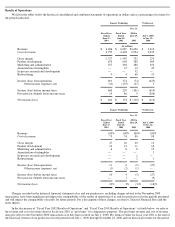
Fiscal Year 2002 Results of Operations
Revenue. Revenue in fiscal year 2002 was $6.087 billion, up 2% from $5.966 billion in pro forma fiscal year 2001. The increase in
revenue was primarily due to improved unit sales volume and product mix that was substantially offset by price erosion. Our unit shipments
increased from 43 million units in pro forma fiscal year 2001 to 55 million units in fiscal year 2002. This increase was primarily caused by
market share gains driven by increased unit shipments of personal storage and enterprise storage rigid disc drive products to OEMs and
continued growth in the rigid disc drive market for consumer electronics such as Microsoft’s Xbox. We attribute these gains in market share
primarily to the market acceptance of our 40 gigabyte personal storage disc drives and our 73 gigabyte enterprise storage disc drive, each of
which achieved volume production in the beginning of fiscal year 2002. In addition, we gained a higher share of some of our OEM customers’
rigid disc drive purchases due to favorable execution versus our competitors and due to industry consolidation. Our strategy to implement
operational efficiencies has increased our manufacturing flexibility and in fiscal year 2002 this enabled us to take advantage of unforecasted
customer demand and deliver products on short notice.
Our overall average unit sales price for our rigid disc drive products was $118, $109, $111 and $100 for the first, second, third and fourth
quarters of fiscal year 2002, respectively. Average price erosion from pro forma fiscal year 2001 to fiscal year 2002 was approximately 20%.
Price erosion during the period was driven primarily by the introduction of new, higher storage capacity products. Due to the achievement of
higher areal densities, these new products require fewer discs and read/write heads and therefore cost less to produce. Since they cost less to
produce, these products can be priced lower than would otherwise be possible and, as a result, drive down prices of older generation products.
Competition also contributed to price erosion during this period. The pricing environment during the fourth quarter of fiscal year 2002 was
extremely aggressive; a condition that was exacerbated by competitors exiting the industry and liquidating their excess inventory.
During fiscal year 2002, we continued to maintain various sales programs aimed at increasing customer demand. We exercise a
considerable degree of judgment in formulating the underlying estimates related to distributor inventory levels, sales program participation and
customer claims submittals in determining the provision for such programs. During fiscal year 2002, the total provision for sales programs
recorded as contra-
revenue was approximately 4% of total revenue, compared to 3% of total revenue over each of the two previous fiscal years.
The increase in sales program expenses during fiscal year 2002 was due primarily to the higher cost of price protection programs, which are
based on estimates of distributor inventory levels and current and future price erosion rates. As price erosion rates in the rigid disc drive
industry escalated during the fourth quarter of fiscal year 2002, the cost of price protection programs increased accordingly. Furthermore, in the
third quarter of fiscal year 2002, our North American distribution customers transitioned from a consignment model, where the inventory is
owned by us until it is sold by the distributor, to a sell-in model, where the inventory is owned by the distributor. During fiscal year 2002, this
transition resulted in a one-time increase in total revenue, operating income and net income of approximately 1%, 3% and 7%, respectively. In
the third quarter of fiscal year 2002, this transition resulted in a one-time increase in total revenue, operating income and net income of
approximately 4%, 9% and 9%, respectively. Because our North American distributors have transitioned to the sell-in model, the cost of our
price protection programs may trend higher in future periods. Historically, actual sales program costs have approximated the estimated cost of
such programs recognized in our financial statements. Variances between actual and estimated costs of sales programs during each of the last
three fiscal years have not been material due to our ongoing reviews of actual program expenses to ensure that accruals are continuously
adjusted to approximate the actual costs of sales programs. Should actual sales program costs in any period differ significantly from estimated
sales program costs either as a result of higher than expected rates of price erosion or otherwise, our future results of operations could be
materially affected.
Cost of Revenue. Cost of revenue for fiscal year 2002 was $4.494 billion, up 1% from $4.457 billion for pro forma fiscal year 2001.
Gross margin as a percentage of revenue for fiscal year 2002 was 26% as compared with 25% for pro forma fiscal year 2001. As discussed in
the paragraph above, we experienced significant price erosion during the period. This price erosion exerted substantial downward pressure on
our gross margins. However, this downward pressure was more than offset by improved absorption of fixed costs from increased unit sales
volume and a shift in mix to higher storage capacity products. It was also offset by ongoing cost savings as a result of our restructuring
activities and our program to implement operational efficiencies. Our restructuring activities during these periods were comprised of workforce
reductions, capacity reductions, including closure of facilities or portions of facilities, and the write-off of excess equipment, primarily in our
Far East operations in Malaysia and Thailand. Our cost structure decreased as a result of reductions in our total number of manufacturing
facilities and headcount. Pursuant to our strategy to implement operational efficiencies, we have increased the degree of automation in our
manufacturing operations, closed facilities, reduced headcount and reconfigured our production lines to handle multiple products.
32