Rite Aid 2016 Annual Report Download - page 65
Download and view the complete annual report
Please find page 65 of the 2016 Rite Aid annual report below. You can navigate through the pages in the report by either clicking on the pages listed below, or by using the keyword search tool below to find specific information within the annual report.-
 1
1 -
2
-
3
-
4
-
5
-
6
-
7
-
8
-
9
-
10
-
11
-
12
-
13
-
14
-
15
-
16
-
17
-
18
-
19
-
20
-
21
-
22
-
23
-
24
-
25
-
26
-
27
-
28
-
29
-
30
-
31
-
32
-
33
-
34
-
35
-
36
-
37
-
38
-
39
-
40
-
41
-
42
-
43
-
44
-
45
-
46
-
47
-
48
-
49
-
50
-
51
-
52
-
53
-
54
-
 55
55 -
 56
56 -
 57
57 -
 58
58 -
 59
59 -
 60
60 -
 61
61 -
 62
62 -
 63
63 -
 64
64 -
 65
65 -
 66
66 -
 67
67 -
 68
68 -
 69
69 -
 70
70 -
 71
71 -
 72
72 -
 73
73 -
 74
74 -
 75
75 -
76
-
77
-
78
-
79
-
80
-
81
-
82
-
83
-
84
-
85
-
86
-
87
-
88
-
89
-
90
-
91
-
92
-
93
-
94
-
95
-
96
-
97
-
98
-
99
-
100
-
101
-
102
-
103
-
104
-
105
-
106
-
107
-
108
-
109
-
110
-
111
-
112
-
113
-
114
-
115
-
116
-
117
-
118
-
119
-
120
-
121
-
122
-
123
-
124
-
125
-
126
-
127
-
128
-
129
-
130
-
131
-
132
-
133
-
134
-
135
-
136
-
137
-
138
-
139
-
140
-
141
-
142
-
143
-
144
-
145
-
146
-
147
-
148
-
149
-
150
-
151
-
152
-
153
-
154
-
155
-
156
-
157
-
158
-
159
-
160
-
161
-
162
-
163
-
164
-
165
 |
 |

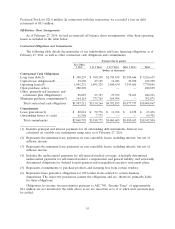
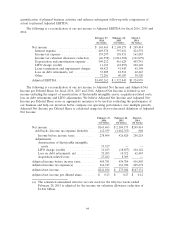
In addition to Adjusted EBITDA, Adjusted Net Income and Adjusted Net Income per Diluted
Share, we occasionally refer to several other Non-GAAP measures, on a less frequent basis, in order to
describe certain components of our business and how we utilize them to describe our results. These
measures include but are not limited to Adjusted EBITDA Gross Margin and Gross Profit (gross
margin/gross profit excluding non-Adjusted EBITDA items), Adjusted EBITDA SG&A (SG&A
expenses excluding non-Adjusted EBITDA items), FIFO Gross Margin and FIFO Gross Profit (gross
margin/gross profit before LIFO charges), and Free Cash Flow (Adjusted EBITDA less cash paid for
interest, rent on closed stores, capital expenditures, acquisition costs and the change in working
capital).
We include these non-GAAP financial measures in our earnings announcements in order to
provide transparency to our investors and enable investors to better compare our operating
performance with the operating performance of our competitors including with those of our
competitors having different capital structures. Adjusted EBITDA, Adjusted Net Income, Adjusted Net
Income per Diluted Share or other non-GAAP measures should not be considered in isolation from,
and are not intended to represent an alternative measure of, operating results or of cash flows from
operating activities, as determined in accordance with GAAP. Our definition of these non-GAAP
measures may not be comparable to similarly titled measurements reported by other companies.
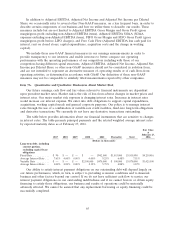
Item 7A. Quantitative and Qualitative Disclosures About Market Risk
Our future earnings, cash flow and fair values relevant to financial instruments are dependent
upon prevalent market rates. Market risk is the risk of loss from adverse changes in market prices and
interest rates. Our major market risk exposure is changing interest rates. Increases in interest rates
would increase our interest expense. We enter into debt obligations to support capital expenditures,
acquisitions, working capital needs and general corporate purposes. Our policy is to manage interest
rates through the use of a combination of variable-rate credit facilities, fixed-rate long-term obligations
and derivative transactions. We currently do not have any derivative transactions outstanding.
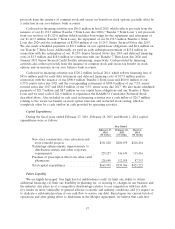
The table below provides information about our financial instruments that are sensitive to changes
in interest rates. The table presents principal payments and the related weighted average interest rates
by expected maturity dates as of February 27, 2016.
Fair Value
at
February 27,
2017 2018 2019 2020 2021 Thereafter Total 2016
(Dollars in thousands)
Long-term debt, including
current portion,
excluding capital lease
obligations
Fixed Rate .......... $ 90 $ — $ — $ — $902,000 $3,033,000 $3,935,090 $4,210,416
Average Interest Rate . . . 7.61% 0.00% 0.00% 0.00% 9.25% 6.48% 7.11%
Variable Rate ........ $ — $ — $ — $2,100,000 $470,000 $ 500,000 $3,070,000 $3,025,500
Average Interest Rate . . . 0.00% 0.00% 0.00% 2.12% 5.75% 4.88% 3.12%
Our ability to satisfy interest payment obligations on our outstanding debt will depend largely on
our future performance, which, in turn, is subject to prevailing economic conditions and to financial,
business and other factors beyond our control. If we do not have sufficient cash flow to service our
interest payment obligations on our outstanding indebtedness and if we cannot borrow or obtain equity
financing to satisfy those obligations, our business and results of operations could be materially
adversely affected. We cannot be assured that any replacement borrowing or equity financing could be
successfully completed.
65