Rite Aid 2016 Annual Report Download - page 56
Download and view the complete annual report
Please find page 56 of the 2016 Rite Aid annual report below. You can navigate through the pages in the report by either clicking on the pages listed below, or by using the keyword search tool below to find specific information within the annual report.-
 1
1 -
2
-
3
-
4
-
5
-
6
-
7
-
8
-
9
-
10
-
11
-
12
-
13
-
14
-
15
-
16
-
17
-
18
-
19
-
20
-
21
-
22
-
23
-
24
-
25
-
26
-
27
-
28
-
29
-
30
-
31
-
32
-
33
-
34
-
35
-
36
-
37
-
38
-
39
-
40
-
41
-
42
-
43
-
44
-
45
-
 46
46 -
 47
47 -
 48
48 -
 49
49 -
 50
50 -
 51
51 -
 52
52 -
 53
53 -
 54
54 -
 55
55 -
 56
56 -
 57
57 -
 58
58 -
 59
59 -
 60
60 -
 61
61 -
 62
62 -
 63
63 -
 64
64 -
 65
65 -
 66
66 -
67
-
68
-
69
-
70
-
71
-
72
-
73
-
74
-
75
-
76
-
77
-
78
-
79
-
80
-
81
-
82
-
83
-
84
-
85
-
86
-
87
-
88
-
89
-
90
-
91
-
92
-
93
-
94
-
95
-
96
-
97
-
98
-
99
-
100
-
101
-
102
-
103
-
104
-
105
-
106
-
107
-
108
-
109
-
110
-
111
-
112
-
113
-
114
-
115
-
116
-
117
-
118
-
119
-
120
-
121
-
122
-
123
-
124
-
125
-
126
-
127
-
128
-
129
-
130
-
131
-
132
-
133
-
134
-
135
-
136
-
137
-
138
-
139
-
140
-
141
-
142
-
143
-
144
-
145
-
146
-
147
-
148
-
149
-
150
-
151
-
152
-
153
-
154
-
155
-
156
-
157
-
158
-
159
-
160
-
161
-
162
-
163
-
164
-
165
 |
 |
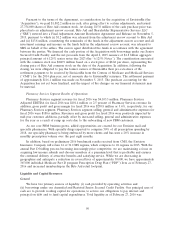
Net Cash Provided By (Used In) Operating, Investing and Financing Activities
Cash flow provided by operating activities was $997.4 million in fiscal 2016. Cash flow was
positively impacted by net income and a decrease in inventory. The cash provided by accounts
receivable and used by other assets and liabilities, relate primarily to the receipt of amounts due from
CMS and the corresponding payment of amounts due under certain reinsurance contracts, as well as
residual amounts due to TPG under the Acquisition agreement, which relate to the December 31, 2014
CMS plan year.
Cash flow provided by operating activities was $649.0 million in fiscal 2015. Cash flow was
positively impacted by net income and a decrease in inventory. These cash inflows were partially offset
by a reduction of accounts payable resulting from the inventory reduction and the timing of payments,
cash used in other assets and liabilities, net, due primarily to lower closed store reserves and
self-insurance liability and higher accounts receivable due primarily to increased pharmacy sales and the
timing of payments.
Cash flow provided by operating activities was $702.0 million in fiscal 2014. Cash flow was
positively impacted by net income and a decrease in inventory, partially offset by a reduction of
accounts payable resulting from the inventory reduction and the timing of payments, cash used in other
assets and liabilities, net, due primarily to lower vendor deferred income and pension liability and
higher accounts receivable due primarily to increased pharmacy sales and the timing of payments.
Included in cash used by other assets and liabilities, net is the $26.7 million excess tax benefit relating
to stock option exercise and restricted stock vesting windfalls that was recorded as a component of
income tax benefit and an increase of APIC.
Cash used in investing activities was $2,401.9 million in fiscal 2016. Cash used in investing activities
increased due to expenditures of $1,778.4 million, net of cash acquired, related to the acquisition of
EnvisionRx compared to the prior year expenditures of $69.8 million, net of cash acquired, related to
the acquisitions of Health Dialog and RediClinic in April 2014. Cash used for the purchase of property,
plant, and equipment was higher than in the prior year due to a higher investment in Wellness store
remodels.
Cash used in investing activities was $593.7 million in fiscal 2015. Cash used for the purchase of
property, plant, and equipment and prescription files was higher than in fiscal 2014 due to a higher
investment in Wellness store remodels and prescription file buys. Proceeds from the sale of assets were
lower as compared to fiscal 2014. Also reflected in investing activities are expenditures of $69.8 million,
net of cash acquired, related to the acquisitions of Health Dialog and RediClinic.
Cash used in investing activities was $364.9 million in fiscal 2014. Cash used for the purchase of
property, plant and equipment and prescriptions files was higher than in fiscal 2013 due to a higher
investment in Wellness store remodels and prescription file buys, which was partially offset by proceeds
from asset dispositions, sale-leaseback transactions, the sale of lease rights of $8.8 million relating to
one specific store and insurance settlement proceeds of $15.1 million related to buildings and
equipment that were destroyed during hurricane Sandy.
Cash provided by financing activities was $1,413.0 million in fiscal 2016, which reflects $1.8 billion
in proceeds from our 6.125% Notes, which was used to finance the majority of the cash portion of our
acquisition of EnvisionRx, which is included in investing activities, as well as net proceeds from the
revolver of $375.0 million. We also redeemed $650.0 million of our 8.0% senior secured notes and
made scheduled payments of $22.7 million on our capital lease obligations. Additionally, we paid an
early redemption premium of $26.0 million in connection with the redemption of our 8.0% senior
secured notes and deferred financing costs paid in connection with the January 2015 senior secured
credit facility refinancing and 6.125% Notes proceeds. Cash provided by financing activities also reflects
56