Rite Aid 2016 Annual Report Download - page 34
Download and view the complete annual report
Please find page 34 of the 2016 Rite Aid annual report below. You can navigate through the pages in the report by either clicking on the pages listed below, or by using the keyword search tool below to find specific information within the annual report.-
 1
1 -
2
-
3
-
4
-
5
-
6
-
7
-
8
-
9
-
10
-
11
-
12
-
13
-
14
-
15
-
16
-
17
-
18
-
19
-
20
-
21
-
22
-
23
-
 24
24 -
 25
25 -
 26
26 -
 27
27 -
 28
28 -
 29
29 -
 30
30 -
 31
31 -
 32
32 -
 33
33 -
 34
34 -
 35
35 -
 36
36 -
 37
37 -
 38
38 -
 39
39 -
 40
40 -
 41
41 -
 42
42 -
 43
43 -
 44
44 -
45
-
46
-
47
-
48
-
49
-
50
-
51
-
52
-
53
-
54
-
55
-
56
-
57
-
58
-
59
-
60
-
61
-
62
-
63
-
64
-
65
-
66
-
67
-
68
-
69
-
70
-
71
-
72
-
73
-
74
-
75
-
76
-
77
-
78
-
79
-
80
-
81
-
82
-
83
-
84
-
85
-
86
-
87
-
88
-
89
-
90
-
91
-
92
-
93
-
94
-
95
-
96
-
97
-
98
-
99
-
100
-
101
-
102
-
103
-
104
-
105
-
106
-
107
-
108
-
109
-
110
-
111
-
112
-
113
-
114
-
115
-
116
-
117
-
118
-
119
-
120
-
121
-
122
-
123
-
124
-
125
-
126
-
127
-
128
-
129
-
130
-
131
-
132
-
133
-
134
-
135
-
136
-
137
-
138
-
139
-
140
-
141
-
142
-
143
-
144
-
145
-
146
-
147
-
148
-
149
-
150
-
151
-
152
-
153
-
154
-
155
-
156
-
157
-
158
-
159
-
160
-
161
-
162
-
163
-
164
-
165
 |
 |

PART II
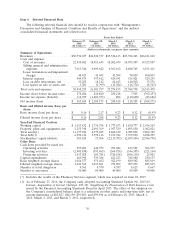
Item 5. Market for Registrant’s Common Equity, Related Stockholder Matters and Issuer Purchases
of Equity Securities.
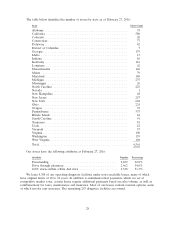
Our common stock is listed on the NYSE under the symbol ‘‘RAD.’’ On April 8, 2016, we had
approximately 19,480 stockholders of record. Quarterly high and low closing stock prices, based on the
composite transactions, are shown below.
Fiscal Year Quarter High Low
2017 (through April 8, 2016) ....................... First $8.19 $7.94
2016 ........................................ First 8.87 7.31
Second 9.32 7.75
Third 8.67 6.05
Fourth 7.96 7.58
2015 ........................................ First 8.38 6.05
Second 8.50 5.98
Third 6.64 4.51
Fourth 8.34 5.39
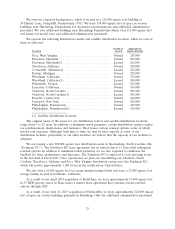
We have not declared or paid any cash dividends on our common stock since the third quarter of
fiscal 2000 and we do not anticipate paying cash dividends on our common stock in the foreseeable
future. Our senior secured credit facility, second priority secured term loan facilities and some of the
indentures that govern our other outstanding indebtedness restrict our ability to pay dividends.
We have not sold any unregistered equity securities during the period covered by this report, nor
have we repurchased any of our common stock, during the period covered by this report.
Pursuant to the terms of the acquisition agreement, we issued approximately 27.8 million shares of
common stock in connection with the June 24, 2015 acquisition of EnvisionRx.
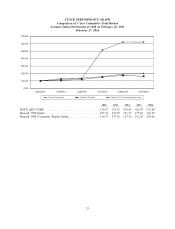
STOCK PERFORMANCE GRAPH
The graph below compares the yearly percentage change in the cumulative total stockholder return
on our common stock for the last five fiscal years with the cumulative total return on (i) the
Russell 1000 Consumer Staples Index, and (ii) the Russell 1000 Index, over the same period (assuming
the investment of $100.00 in our common stock and such indexes on February 26, 2011 and
reinvestment of dividends).
For comparison of cumulative total return, we have elected to use the Russell 1000 Consumer
Staples Index, consisting of 51 companies including the three largest drugstore chains, and the
Russell 1000 Index. This allows comparison of the company to a peer group of similar sized companies.
We are one of the companies included in the Russell 1000 Consumer Staples Index and the
Russell 1000 Index. The Russell 1000 Consumer Staples Index is a capitalization-weighted index of
companies that provide products directly to consumers that are typically considered nondiscretionary
items based on consumer purchasing habits. The Russell 1000 Index consists of the largest 1000
companies in the Russell 3000 Index and represents the universe of large capitalization stocks from
which many active money managers typically select.
34