Ricoh 2012 Annual Report Download - page 11
Download and view the complete annual report
Please find page 11 of the 2012 Ricoh annual report below. You can navigate through the pages in the report by either clicking on the pages listed below, or by using the keyword search tool below to find specific information within the annual report.-
 1
1 -
 2
2 -
 3
3 -
 4
4 -
 5
5 -
 6
6 -
 7
7 -
 8
8 -
 9
9 -
 10
10 -
 11
11 -
 12
12 -
 13
13 -
 14
14 -
 15
15 -
 16
16 -
 17
17 -
 18
18 -
 19
19 -
 20
20 -
 21
21 -
 22
22 -
23
-
24
-
25
-
26
-
27
-
28
-
29
-
30
-
31
-
32
-
33
-
34
-
35
-
36
-
37
-
38
-
39
-
40
-
41
-
42
-
43
-
44
-
45
-
46
-
47
-
48
-
49
-
50
-
51
-
52
-
53
-
54
-
55
-
56
-
57
-
58
-
59
-
60
-
61
-
62
-
63
-
64
-
65
-
66
-
67
-
68
-
69
-
70
-
71
-
72
-
73
-
74
-
75
-
76
-
77
-
78
-
79
-
80
-
81
-
82
-
83
-
84
-
85
-
86
-
87
-
88
-
89
-
90
-
91
-
92
-
93
-
94
-
95
-
96
-
97
-
98
-
99
-
100
-
101
-
102
 |
 |

Ricoh Group Sustainability Report 2012 10
Top Message About us Our Activities
About the Ricoh Group
Data
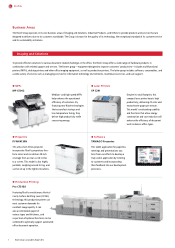
Industrial Products
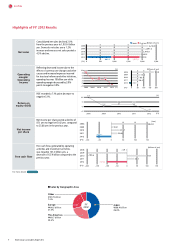
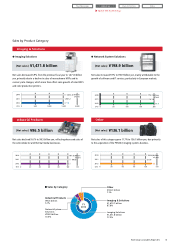
Sales by Product Category
● Imaging Solutions ● Network System Solutions
¥1,471.8 billion
[Net sales]
¥96.5 billion
[Net sales] ¥136.1 billion
[Net sales]
¥198.9 billion
[Net sales]
Net sales decreased 3.9% from the previous fiscal year to 1,471.8 billion
yen, primarily due to a decline in sales of monochrome MFPs and to
currency rate changes, which more than offset sales growth of color MFPs
and color production printers.
Net sales declined 9.6 % to 96.5 billion yen, reflecting decreased sales of
the semiconductor and thermal media businesses.
Net sales of this category grew 11.7% to 136.1 billion yen, due primarily
to the acquisition of the PENTAX imaging systems business.
Net sales increased 9.7% to 198.9 billion yen, mainly attributable to the
growth of software and IT services, particularly in European markets.
Imaging & Solutions
0 500 1,000 1,500 2,000
1,614.3
2010
1,531.2
2011
1,471.8
2012
(FY)
(Billions
of yen)
020406080100120
101.6
2010
106.8
2011
96.5
2012
(FY)
(Billions
of yen)
Other
0306090120150
124.4
2010
121.8
2011
136.1
2012
(FY)
(Billions
of yen)
■ Sales by Category Other
¥136.1 billion
7.1%
Imaging & Solutions
¥1,670.7 billion
87.8%
Imaging Solutions
¥1,471.8 billion
77.3%
Industrial Products
¥96.5 billion
5.1%
Network System
Solutions
¥198.9 billion
10.5%
FY
2012
0 50 100 150 200
175.3
181.4
198.9
2010
2011
2012
(FY)
(Billions
of yen)