Reebok 2011 Annual Report Download - page 61
Download and view the complete annual report
Please find page 61 of the 2011 Reebok annual report below. You can navigate through the pages in the report by either clicking on the pages listed below, or by using the keyword search tool below to find specific information within the annual report.-
 1
1 -
2
-
3
-
4
-
5
-
6
-
7
-
8
-
9
-
10
-
11
-
12
-
13
-
14
-
15
-
16
-
17
-
18
-
19
-
20
-
21
-
22
-
23
-
24
-
25
-
26
-
27
-
28
-
29
-
30
-
31
-
32
-
33
-
34
-
35
-
36
-
37
-
38
-
39
-
40
-
41
-
42
-
43
-
44
-
45
-
46
-
47
-
48
-
49
-
50
-
 51
51 -
 52
52 -
 53
53 -
 54
54 -
 55
55 -
 56
56 -
 57
57 -
 58
58 -
 59
59 -
 60
60 -
 61
61 -
 62
62 -
 63
63 -
 64
64 -
 65
65 -
 66
66 -
 67
67 -
 68
68 -
 69
69 -
 70
70 -
 71
71 -
72
-
73
-
74
-
75
-
76
-
77
-
78
-
79
-
80
-
81
-
82
-
83
-
84
-
85
-
86
-
87
-
88
-
89
-
90
-
91
-
92
-
93
-
94
-
95
-
96
-
97
-
98
-
99
-
100
-
101
-
102
-
103
-
104
-
105
-
106
-
107
-
108
-
109
-
110
-
111
-
112
-
113
-
114
-
115
-
116
-
117
-
118
-
119
-
120
-
121
-
122
-
123
-
124
-
125
-
126
-
127
-
128
-
129
-
130
-
131
-
132
-
133
-
134
-
135
-
136
-
137
-
138
-
139
-
140
-
141
-
142
-
143
-
144
-
145
-
146
-
147
-
148
-
149
-
150
-
151
-
152
-
153
-
154
-
155
-
156
-
157
-
158
-
159
-
160
-
161
-
162
-
163
-
164
-
165
-
166
-
167
-
168
-
169
-
170
-
171
-
172
-
173
-
174
-
175
-
176
-
177
-
178
-
179
-
180
-
181
-
182
-
183
-
184
-
185
-
186
-
187
-
188
-
189
-
190
-
191
-
192
-
193
-
194
-
195
-
196
-
197
-
198
-
199
-
200
-
201
-
202
-
203
-
204
-
205
-
206
-
207
-
208
-
209
-
210
-
211
-
212
-
213
-
214
-
215
-
216
-
217
-
218
-
219
-
220
-
221
-
222
-
223
-
224
-
225
-
226
-
227
-
228
-
229
-
230
-
231
-
232
-
233
-
234
-
235
-
236
-
237
-
238
-
239
-
240
-
241
-
242
 |
 |

adidas Group
2011 Annual Report
TO OUR SHAREHOLDERS
57
2011
01.8 Our Share
of institutional shareholders were identified in other regions of the
world. adidas Group Management, which comprises current members
of the Executive and Supervisory Boards, holds 2% in total
SEE
CORPORATE GOVERNANCE REPORT INCLUDING THE DECLARATION ON CORPORATE GOVERNANCE, P. 45
.
Undisclosed holdings, which also include private investors, account
for the remaining 11%
DIAGRAM 06
.
Voting rights notifications received
In 2011, adidas AG received nine voting rights notifications in
accordance with § 21 section 1 of the German Securities Trading
Act (Wert papierhandelsgesetz – WpHG). All voting rights notifica-
tions received in 2011 and thereafter can be viewed on our corporate
website :
WWW.ADIDAS-GROUP.COM/VOTING_RIGHTS_NOTIFICATIONS
. Information on
investments that have exceeded or fallen below a certain threshold
can also be found in the Notes section of this Annual Report
SEE
NOTE 25, P. 198
.
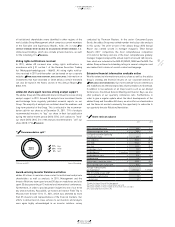
adidas AG share again receives strong analyst support
The adidas Group and the adidas AG share continued to receive strong
analyst support in 2011. Around 35 analysts from investment banks
and brokerage firms regularly published research reports on our
Group. The majority of analysts are confident about the medium- and
long-term potential of the Group. This is reflected in the recommen-
dation split for our share as at December 31, 2011. 71% of analysts
recommended investors to “buy” our share in their last publication
during the twelve-month period (2010: 55%). 24% advised to “hold”
our share (2010: 28%). 5% of the analysts recommended to “sell” our
share (2010: 17%)
DIAGRAM 07
.
Award-winning Investor Relations activities
adidas AG strives to maintain close contact to institutional and private
shareholders as well as analysts. In 2011, Management and the
Investor Relations team spent around 30 days on roadshows and also
spent 20 days presenting at 13 national and international conferences.
Furthermore, in order to provide greater insight into one of our three
key attack markets, Russia/CIS, we hosted an Investor Field Trip to
Moscow from October 10 to 11, 2011, which was attended by more
than 35 investors and representatives of the financial markets. Our
efforts to deliver best-in-class services to our investors and analysts
were again highly acknowledged in an investor relations survey
conducted by Thomson Reuters. In the sector Consumer/Luxury
Goods, the adidas Group was ranked number two by buy-side analysts
in this survey. The print version of the adidas Group 2010 Annual
Report was ranked second in manager magazin’s “Best Annual
Reports 2011” competition, the most comprehensive competition
of its kind in Germany and one of the most comprehensive globally.
manager magazin analysed the annual reports of around 160 corpora-
tions which are included in the DAX-30, MDAX, SDAX and TecDAX. The
adidas Group achieved outstanding ratings in several categories and
was ranked first in terms of overall content and language.
Extensive financial information available online
We offer extensive information around our share as well as the adidas
Group’s strategy and financial results on our corporate website at
:
WWW.ADIDAS-GROUP.COM/INVESTORS
. Our event calendar lists all conferences
and roadshows we attend and provides all presentations for download.
In addition to live webcasts of all major events such as our Analyst
Conferences, the Annual General Meeting and Investor Days, we also
offer podcasts of our quarterly conference calls. Furthermore, in
order to give a regular update about the latest developments of the
adidas Group and the adidas AG share, we also offer our shareholders
and the financial market community the opportunity to subscribe to
our quarterly Investor Relations Newsletter.
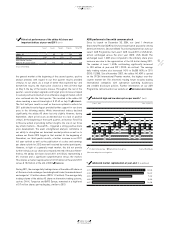
08 Share ratios at a glance
2011 2010
Basic earnings per share €3.20 2.71
Diluted earnings per share €3.20 2.71
Cash generated from operating
activities per share €3.79 4.27
Year-end price €50.26 48.89
Year-high €57.42 51.48
Year-low €43.22 35.01
Dividend per share €1.00 1) 0.80
Dividend payout € in millions 209 2) 167
Dividend payout ratio %31.2 29.5
Dividend yield %2.0 1.6
Shareholders’ equity per share €25.46 22.06
Price-earnings ratio at year-end 15.7 18.0
Average trading volume
per trading day 3) shares 1,153,246 1,170,523
DAX-30 ranking at year-end 4)
by market capitalisation 16 16
by turnover 21 23
1) Subject to Annual General Meeting approval.
2) Based on number of shares outstanding at year-end.
3) Based on number of shares traded on all German stock exchanges.
4) As reported by Deutsche Börse AG.
07 Recommendation split 1)
1) At year-end 2011. Source: Bloomberg.
2011 1 71% Buy
2 24% Hold
3 5% Sell
1
2
3