Reebok 2011 Annual Report Download - page 228
Download and view the complete annual report
Please find page 228 of the 2011 Reebok annual report below. You can navigate through the pages in the report by either clicking on the pages listed below, or by using the keyword search tool below to find specific information within the annual report.-
 1
1 -
2
-
3
-
4
-
5
-
6
-
7
-
8
-
9
-
10
-
11
-
12
-
13
-
14
-
15
-
16
-
17
-
18
-
19
-
20
-
21
-
22
-
23
-
24
-
25
-
26
-
27
-
28
-
29
-
30
-
31
-
32
-
33
-
34
-
35
-
36
-
37
-
38
-
39
-
40
-
41
-
42
-
43
-
44
-
45
-
46
-
47
-
48
-
49
-
50
-
51
-
52
-
53
-
54
-
55
-
56
-
57
-
58
-
59
-
60
-
61
-
62
-
63
-
64
-
65
-
66
-
67
-
68
-
69
-
70
-
71
-
72
-
73
-
74
-
75
-
76
-
77
-
78
-
79
-
80
-
81
-
82
-
83
-
84
-
85
-
86
-
87
-
88
-
89
-
90
-
91
-
92
-
93
-
94
-
95
-
96
-
97
-
98
-
99
-
100
-
101
-
102
-
103
-
104
-
105
-
106
-
107
-
108
-
109
-
110
-
111
-
112
-
113
-
114
-
115
-
116
-
117
-
118
-
119
-
120
-
121
-
122
-
123
-
124
-
125
-
126
-
127
-
128
-
129
-
130
-
131
-
132
-
133
-
134
-
135
-
136
-
137
-
138
-
139
-
140
-
141
-
142
-
143
-
144
-
145
-
146
-
147
-
148
-
149
-
150
-
151
-
152
-
153
-
154
-
155
-
156
-
157
-
158
-
159
-
160
-
161
-
162
-
163
-
164
-
165
-
166
-
167
-
168
-
169
-
170
-
171
-
172
-
173
-
174
-
175
-
176
-
177
-
178
-
179
-
180
-
181
-
182
-
183
-
184
-
185
-
186
-
187
-
188
-
189
-
190
-
191
-
192
-
193
-
194
-
195
-
196
-
197
-
198
-
199
-
200
-
201
-
202
-
203
-
204
-
205
-
206
-
207
-
208
-
209
-
210
-
211
-
212
-
213
-
214
-
215
-
216
-
217
-
 218
218 -
 219
219 -
 220
220 -
 221
221 -
 222
222 -
 223
223 -
 224
224 -
 225
225 -
 226
226 -
 227
227 -
 228
228 -
 229
229 -
 230
230 -
 231
231 -
 232
232 -
 233
233 -
 234
234 -
 235
235 -
 236
236 -
 237
237 -
 238
238 -
239
-
240
-
241
-
242
 |
 |

adidas Group
2011 Annual Report
ADDITIONAL INFORMATION
224
2011
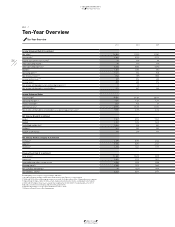
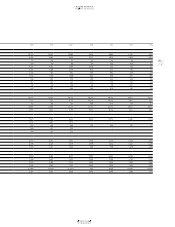
05.1 Ten-Year Overview
Ten-Year Overview
05.1
.. Ten-Year Overview
2011 2010 2009
Income Statement Data (€ in millions)
Net sales 2) 13,344 11,990 10,381
Gross profit 2) 6,344 5,730 4,712
Royalty and commission income 2) 93 100 86
Other operating income 2) 98 110 100
Other operating expenses 2) 5,524 5,046 4,390
EBITDA 2) 1,257 1,159 780
Operating profit 2) 3) 1,011 894 508
Net financial result 2) 4) (84) (88) (150)
Income before taxes 2) 4) 927 806 358
Income taxes 2) 257 238 113
Net income attributable to non-controlling interests 2) 4) 1 (1) 0
Net income attributable to shareholders 5) 671 567 245
Income Statement Ratios
Gross margin 2) 47.5% 47.8% 45.4%
Operating margin 2) 3) 7.6% 7.5% 4.9%
Interest coverage 2) 13.0 10.1 3.9
Effective tax rate 2) 27.7% 29.5% 31.5%
Net income attributable to shareholders as a percentage of net sales 5) 5.0% 4.7% 2.4%
Net Sales by Brand (€ in millions)
adidas 9,867 8,714 7,520
Reebok 1,962 1,913 1,603
TaylorMade-adidas Golf 1,044 909 831
Rockport 261 252 232
Reebok-CCM Hockey 210 200 177
Net Sales by Product Category (€ in millions)
Footwear 2) 6,275 5,389 4,642
Apparel 2) 5,734 5,380 4,663
Hardware 2) 1,335 1,221 1,076
Balance Sheet Data (€ in millions)
Total assets 4) 11,380 10,618 8,875
Inventories 2,482 2,119 1,471
Receivables and other current assets 2,558 2,324 2,038
Working capital 4) 2,154 1,972 1,649
Net cash/(net borrowings) 90 (221) (917)
Shareholders’ equity 4) 5,327 4,616 3,771
Rounding differences may arise in percentages and totals.
1) Including Reebok, Rockport and Reebok-CCM Hockey from February 1, 2006 onwards.
2) 2004 and 2005 reflect continuing operations as a result of the divestiture of the Salomon business segment.
3) Operating profit figures prior to 2004 exclude royalty and commission income and goodwill amortisation.
4) 2003 and 2004 figures have been restated due to application of IAS 32/IAS 39 and amendment to IAS 19.
5) Includes income from continuing and discontinued operations.
6) Figures adjusted for 1: 4 share split conducted on June 6, 2006.
7) Subject to Annual General Meeting approval.