Reebok 2011 Annual Report Download - page 3
Download and view the complete annual report
Please find page 3 of the 2011 Reebok annual report below. You can navigate through the pages in the report by either clicking on the pages listed below, or by using the keyword search tool below to find specific information within the annual report.-
 1
1 -
 2
2 -
 3
3 -
 4
4 -
 5
5 -
 6
6 -
 7
7 -
 8
8 -
 9
9 -
 10
10 -
 11
11 -
 12
12 -
 13
13 -
 14
14 -
15
-
16
-
17
-
18
-
19
-
20
-
21
-
22
-
23
-
24
-
25
-
26
-
27
-
28
-
29
-
30
-
31
-
32
-
33
-
34
-
35
-
36
-
37
-
38
-
39
-
40
-
41
-
42
-
43
-
44
-
45
-
46
-
47
-
48
-
49
-
50
-
51
-
52
-
53
-
54
-
55
-
56
-
57
-
58
-
59
-
60
-
61
-
62
-
63
-
64
-
65
-
66
-
67
-
68
-
69
-
70
-
71
-
72
-
73
-
74
-
75
-
76
-
77
-
78
-
79
-
80
-
81
-
82
-
83
-
84
-
85
-
86
-
87
-
88
-
89
-
90
-
91
-
92
-
93
-
94
-
95
-
96
-
97
-
98
-
99
-
100
-
101
-
102
-
103
-
104
-
105
-
106
-
107
-
108
-
109
-
110
-
111
-
112
-
113
-
114
-
115
-
116
-
117
-
118
-
119
-
120
-
121
-
122
-
123
-
124
-
125
-
126
-
127
-
128
-
129
-
130
-
131
-
132
-
133
-
134
-
135
-
136
-
137
-
138
-
139
-
140
-
141
-
142
-
143
-
144
-
145
-
146
-
147
-
148
-
149
-
150
-
151
-
152
-
153
-
154
-
155
-
156
-
157
-
158
-
159
-
160
-
161
-
162
-
163
-
164
-
165
-
166
-
167
-
168
-
169
-
170
-
171
-
172
-
173
-
174
-
175
-
176
-
177
-
178
-
179
-
180
-
181
-
182
-
183
-
184
-
185
-
186
-
187
-
188
-
189
-
190
-
191
-
192
-
193
-
194
-
195
-
196
-
197
-
198
-
199
-
200
-
201
-
202
-
203
-
204
-
205
-
206
-
207
-
208
-
209
-
210
-
211
-
212
-
213
-
214
-
215
-
216
-
217
-
218
-
219
-
220
-
221
-
222
-
223
-
224
-
225
-
226
-
227
-
228
-
229
-
230
-
231
-
232
-
233
-
234
-
235
-
236
-
237
-
238
-
239
-
240
-
241
-
242
 |
 |

€ in millions
2011 € in millions
2011
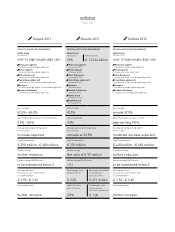
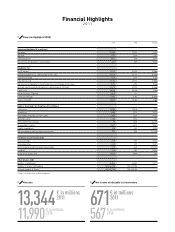
01 Financial Highlights (IFRS)
2011 2010 Change
Operating Highlights (€ in millions)
Net sales 13,344 11,990 11.3%
EBITDA 1,257 1,159 8.5%
Operating profit 1,011 894 13.1%
Net income attributable to shareholders 671 567 18.2%
Key Ratios (%)
Gross margin 47.5% 47.8% (0.3pp)
Operating expenses as a percentage of net sales 41.4% 42.1% (0.7pp)
Operating margin 7.6% 7.5% 0.1pp
Effective tax rate 27.7% 29.5% (1.8pp)
Net income attributable to shareholders as a percentage of net sales 5.0% 4.7% 0.3pp
Average operating working capital as a percentage of net sales 20.8% 20.8% (0.0pp)
Equity ratio 46.8% 43.5% 3.3pp
Net borrowings / EBITDA (0.1) 0.2
Financial leverage (1.7%) 4.8% (6.5pp)
Return on equity 12.6% 12.3% 0.3pp
Balance Sheet and Cash Flow Data (€ in millions)
Total assets 11,380 10,618 7.2%
Inventories 2,482 2,119 17.1%
Receivables and other current assets 2,558 2,324 10.0%
Working capital 2,154 1,972 9.3%
Net cash/(net borrowings) 90 (221) 140.7%
Shareholders’ equity 5,327 4,616 15.4%
Capital expenditure 376 269 39.5%
Net cash generated from operating activities 792 894 (11.5%)
Per Share of Common Stock (€)
Basic earnings 3.20 2.71 18.2%
Diluted earnings 3.20 2.71 18.2%
Net cash generated from operating activities 3.79 4.28 (11.5%)
Dividend 1.00 1) 0.80 25.0%
Share price at year-end 50.26 48.89 2.8%
Other (at year-end)
Number of employees 46,824 42,541 10.1%
Number of shares outstanding 209,216,186 209,216,186 –
Average number of shares 209,216,186 209,216,186 –
Financial Highlights
2011
1) Subject to Annual General Meeting approval.
02 Net sales
13,344
11,990
03 Net income attributable to shareholders
671
567
€ in millions
2010 € in millions
2010