Reebok 2011 Annual Report Download - page 101
Download and view the complete annual report
Please find page 101 of the 2011 Reebok annual report below. You can navigate through the pages in the report by either clicking on the pages listed below, or by using the keyword search tool below to find specific information within the annual report.-
 1
1 -
2
-
3
-
4
-
5
-
6
-
7
-
8
-
9
-
10
-
11
-
12
-
13
-
14
-
15
-
16
-
17
-
18
-
19
-
20
-
21
-
22
-
23
-
24
-
25
-
26
-
27
-
28
-
29
-
30
-
31
-
32
-
33
-
34
-
35
-
36
-
37
-
38
-
39
-
40
-
41
-
42
-
43
-
44
-
45
-
46
-
47
-
48
-
49
-
50
-
51
-
52
-
53
-
54
-
55
-
56
-
57
-
58
-
59
-
60
-
61
-
62
-
63
-
64
-
65
-
66
-
67
-
68
-
69
-
70
-
71
-
72
-
73
-
74
-
75
-
76
-
77
-
78
-
79
-
80
-
81
-
82
-
83
-
84
-
85
-
86
-
87
-
88
-
89
-
90
-
 91
91 -
 92
92 -
 93
93 -
 94
94 -
 95
95 -
 96
96 -
 97
97 -
 98
98 -
 99
99 -
 100
100 -
 101
101 -
 102
102 -
 103
103 -
 104
104 -
 105
105 -
 106
106 -
 107
107 -
 108
108 -
 109
109 -
 110
110 -
 111
111 -
112
-
113
-
114
-
115
-
116
-
117
-
118
-
119
-
120
-
121
-
122
-
123
-
124
-
125
-
126
-
127
-
128
-
129
-
130
-
131
-
132
-
133
-
134
-
135
-
136
-
137
-
138
-
139
-
140
-
141
-
142
-
143
-
144
-
145
-
146
-
147
-
148
-
149
-
150
-
151
-
152
-
153
-
154
-
155
-
156
-
157
-
158
-
159
-
160
-
161
-
162
-
163
-
164
-
165
-
166
-
167
-
168
-
169
-
170
-
171
-
172
-
173
-
174
-
175
-
176
-
177
-
178
-
179
-
180
-
181
-
182
-
183
-
184
-
185
-
186
-
187
-
188
-
189
-
190
-
191
-
192
-
193
-
194
-
195
-
196
-
197
-
198
-
199
-
200
-
201
-
202
-
203
-
204
-
205
-
206
-
207
-
208
-
209
-
210
-
211
-
212
-
213
-
214
-
215
-
216
-
217
-
218
-
219
-
220
-
221
-
222
-
223
-
224
-
225
-
226
-
227
-
228
-
229
-
230
-
231
-
232
-
233
-
234
-
235
-
236
-
237
-
238
-
239
-
240
-
241
-
242
 |
 |

adidas Group
2011 Annual Report
GROUP MANAGEMENT REPORT – OUR GROUP
97
2011
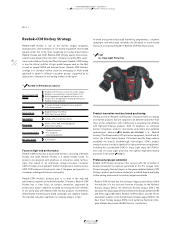
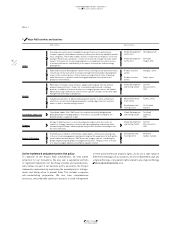
02.6 Research and Development
Highly skilled technical personnel
Our R&D departments comprise experienced and skilled people from
different areas of technical expertise and also from diverse cultural
backgrounds. A significant part of our innovation process and therefore
personnel and skill base relates to consumer and user insights.
Mechanical, biomechanical and engineering specialists, as well as
material engineering and process experts focus on the develop ment
of high-performance and innovative products, concentrating on
providing beneficial experiences for users as well as creating more
sustainable products. For the development of footwear and apparel,
our expertise extends to technical competencies in temperature
and moisture management. Process and production specialists also
form an essential part of our product development strength. Other
professional backgrounds include software develop ment, industrial
and graphic design, electronic engineering, Finite Element Analysis,
advanced CAD design and kinesiology. The number of people
employed in the Group’s R&D activities at December 31, 2011 was
1,029, compared to 1,002 employees in the prior year. This represents
2% of total Group employees. In 2012, we expect the number of R&D
employees to increase slightly.
Initiatives to further streamline product
creation process
We aim at improving our ability to adapt to changing consumer
preferences more quickly, flexibly and efficiently. We achieve this
by facilitating the direct interaction with and involvement of our
suppliers in product creation, quality control, product testing and
commercialisation. In 2011, we completed our Fast and Lean Creation
programme which saw the implementation of direct development
processes for footwear and apparel. In addition, we also made further
progress on strengthening the cross-functional collaboration between
marketing, design and our development teams early in the creation
process. The resulting improved and closer interaction reduces the
amount of costly and time-consuming product changes in the latter
stages of the development process.
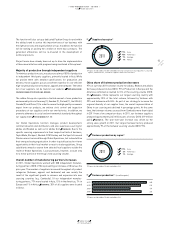
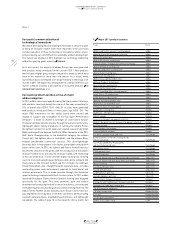
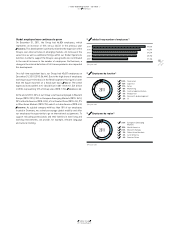
R&D expenses increase 13%
R&D expenses include expenses for personnel and administration,
but exclude other costs, for example those associated with the design
aspect of the product creation process
SEE NOTE 02, P. 182
. In 2011, as in
prior years, all R&D costs were expensed as incurred. adidas Group
R&D expenses increased 13% to € 115 million (2010: € 102 million) as
a result of increases at the adidas brand from initiatives relating to the
development of intelligent products
DIAGRAM 02
. Personnel expenses
represent the largest portion of R&D expenses, accounting for more
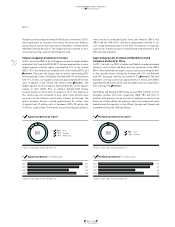
than 68% of total R&D expenses. In 2011, R&D expenses repre-
sented 2.1% of other operating expenses versus 2.0% in the prior year
DIAGRAM 04
. R&D expenses as a percentage of sales increased slightly
to 0.9% (2010: 0.8%)
DIAGRAM 03
.
02 R&D expenses (€ in millions)
2011 115
2010 102
2009 86
2008 81
2007 84
03 R&D expenses (in % of net sales)
2011 0.9
2010 0.8
2009 0.8
2008 0.8
2007 0.8
04 R&D expenses (in % of other operating expenses)
2011 2.1
2010 2.0
2009 2.0
2008 1.9
2007 2.1