Reebok 2011 Annual Report Download - page 216
Download and view the complete annual report
Please find page 216 of the 2011 Reebok annual report below. You can navigate through the pages in the report by either clicking on the pages listed below, or by using the keyword search tool below to find specific information within the annual report.-
 1
1 -
2
-
3
-
4
-
5
-
6
-
7
-
8
-
9
-
10
-
11
-
12
-
13
-
14
-
15
-
16
-
17
-
18
-
19
-
20
-
21
-
22
-
23
-
24
-
25
-
26
-
27
-
28
-
29
-
30
-
31
-
32
-
33
-
34
-
35
-
36
-
37
-
38
-
39
-
40
-
41
-
42
-
43
-
44
-
45
-
46
-
47
-
48
-
49
-
50
-
51
-
52
-
53
-
54
-
55
-
56
-
57
-
58
-
59
-
60
-
61
-
62
-
63
-
64
-
65
-
66
-
67
-
68
-
69
-
70
-
71
-
72
-
73
-
74
-
75
-
76
-
77
-
78
-
79
-
80
-
81
-
82
-
83
-
84
-
85
-
86
-
87
-
88
-
89
-
90
-
91
-
92
-
93
-
94
-
95
-
96
-
97
-
98
-
99
-
100
-
101
-
102
-
103
-
104
-
105
-
106
-
107
-
108
-
109
-
110
-
111
-
112
-
113
-
114
-
115
-
116
-
117
-
118
-
119
-
120
-
121
-
122
-
123
-
124
-
125
-
126
-
127
-
128
-
129
-
130
-
131
-
132
-
133
-
134
-
135
-
136
-
137
-
138
-
139
-
140
-
141
-
142
-
143
-
144
-
145
-
146
-
147
-
148
-
149
-
150
-
151
-
152
-
153
-
154
-
155
-
156
-
157
-
158
-
159
-
160
-
161
-
162
-
163
-
164
-
165
-
166
-
167
-
168
-
169
-
170
-
171
-
172
-
173
-
174
-
175
-
176
-
177
-
178
-
179
-
180
-
181
-
182
-
183
-
184
-
185
-
186
-
187
-
188
-
189
-
190
-
191
-
192
-
193
-
194
-
195
-
196
-
197
-
198
-
199
-
200
-
201
-
202
-
203
-
204
-
205
-
 206
206 -
 207
207 -
 208
208 -
 209
209 -
 210
210 -
 211
211 -
 212
212 -
 213
213 -
 214
214 -
 215
215 -
 216
216 -
 217
217 -
 218
218 -
 219
219 -
 220
220 -
 221
221 -
 222
222 -
 223
223 -
 224
224 -
 225
225 -
 226
226 -
227
-
228
-
229
-
230
-
231
-
232
-
233
-
234
-
235
-
236
-
237
-
238
-
239
-
240
-
241
-
242
 |
 |

adidas Group
2011 Annual Report
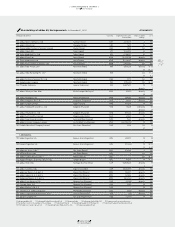
CONSOLIDATED FINANCIAL STATEMENTS
212
2011
212
2011
04.8
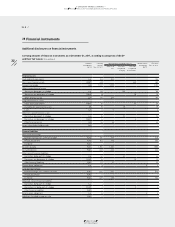
04.8 Notes Notes – Additional Information
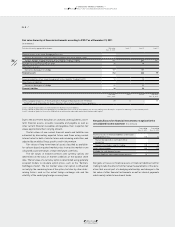
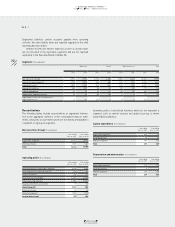
Segmental liabilities contain accounts payable from operating
activities. No other liability items are reported regularly to the chief
operating decision maker.
Interest income and interest expenses as well as income taxes
are not allocated to the reportable segments and are not reported
separately to the Executive Board of adidas AG.
Segments (€ in millions)
Wholesale Retail Other Businesses Total
2011 2010 2011 2010 2011 2010 2011 2010
Net sales (non-Group) 8,971 8,181 2,793 2,389 1,580 1,420 13,344 11,990
Segmental operating profit 2,725 2,572 593 452 427 369 3,745 3,393
Segmental assets 2,859 2,690 703 541 639 514 4,201 3,745
Segmental liabilities 525 537 55 76 137 110 717 723
Capital expenditure 62 33 99 61 28 26 189 120
Depreciation and amortisation 25 22 85 88 9 8 119 118
Impairment losses, net of reversals of
impairment losses 0 (1) (1) 4 0 0 (1) 3
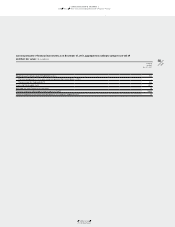
Reconciliations
The following tables include reconciliations of segmental informa-
tion to the aggregate numbers of the consolidated financial state-
ments, taking into account items which are not directly attributable to
a segment or a group of segments.
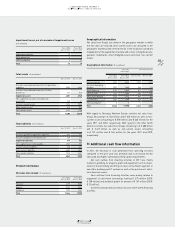
Net sales (non-Group) (€ in millions)
Year ending
Dec. 31, 2011
Year ending
Dec. 31, 2010
Reportable segments 11,764 10,570
Other businesses 1,580 1,420
Total 13,344 11,990
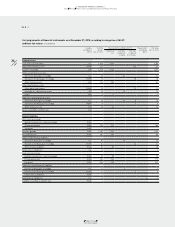
Operating profit (€ in millions)
Year ending
Dec. 31, 2011
Year ending
Dec. 31, 2010
Operating profit for reportable segments 3,318 3,024
Operating profit for other businesses 427 369
HQ/Consolidation 292 212
Marketing working budget (1,361) (1,288)
Other operating expenses (1,758) (1,523)
Royalty and commission income 93 100
Operating profit 1,011 894
Financial income 31 25
Financial expenses (115) (113)
Income before taxes 927 806
Operating profit of centralised functions which do not represent a
segment, such as central treasury and global sourcing, is shown
under HQ/Consolidation.
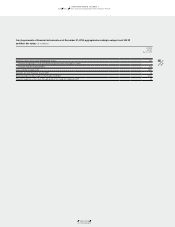
Capital expenditure (€ in millions)
Year ending
Dec. 31, 2011
Year ending
Dec. 31, 2010
Reportable segments 161 94
Other businesses 28 26
HQ/Consolidation 187 149
Total 376 269
Depreciation and amortisation (€ in millions)
Year ending
Dec. 31, 2011
Year ending
Dec. 31, 2010
Reportable segments 110 110
Other businesses 9 8
HQ/Consolidation 130 128
Total 249 246