Reebok 2011 Annual Report Download - page 59
Download and view the complete annual report
Please find page 59 of the 2011 Reebok annual report below. You can navigate through the pages in the report by either clicking on the pages listed below, or by using the keyword search tool below to find specific information within the annual report.-
 1
1 -
2
-
3
-
4
-
5
-
6
-
7
-
8
-
9
-
10
-
11
-
12
-
13
-
14
-
15
-
16
-
17
-
18
-
19
-
20
-
21
-
22
-
23
-
24
-
25
-
26
-
27
-
28
-
29
-
30
-
31
-
32
-
33
-
34
-
35
-
36
-
37
-
38
-
39
-
40
-
41
-
42
-
43
-
44
-
45
-
46
-
47
-
48
-
 49
49 -
 50
50 -
 51
51 -
 52
52 -
 53
53 -
 54
54 -
 55
55 -
 56
56 -
 57
57 -
 58
58 -
 59
59 -
 60
60 -
 61
61 -
 62
62 -
 63
63 -
 64
64 -
 65
65 -
 66
66 -
 67
67 -
 68
68 -
 69
69 -
70
-
71
-
72
-
73
-
74
-
75
-
76
-
77
-
78
-
79
-
80
-
81
-
82
-
83
-
84
-
85
-
86
-
87
-
88
-
89
-
90
-
91
-
92
-
93
-
94
-
95
-
96
-
97
-
98
-
99
-
100
-
101
-
102
-
103
-
104
-
105
-
106
-
107
-
108
-
109
-
110
-
111
-
112
-
113
-
114
-
115
-
116
-
117
-
118
-
119
-
120
-
121
-
122
-
123
-
124
-
125
-
126
-
127
-
128
-
129
-
130
-
131
-
132
-
133
-
134
-
135
-
136
-
137
-
138
-
139
-
140
-
141
-
142
-
143
-
144
-
145
-
146
-
147
-
148
-
149
-
150
-
151
-
152
-
153
-
154
-
155
-
156
-
157
-
158
-
159
-
160
-
161
-
162
-
163
-
164
-
165
-
166
-
167
-
168
-
169
-
170
-
171
-
172
-
173
-
174
-
175
-
176
-
177
-
178
-
179
-
180
-
181
-
182
-
183
-
184
-
185
-
186
-
187
-
188
-
189
-
190
-
191
-
192
-
193
-
194
-
195
-
196
-
197
-
198
-
199
-
200
-
201
-
202
-
203
-
204
-
205
-
206
-
207
-
208
-
209
-
210
-
211
-
212
-
213
-
214
-
215
-
216
-
217
-
218
-
219
-
220
-
221
-
222
-
223
-
224
-
225
-
226
-
227
-
228
-
229
-
230
-
231
-
232
-
233
-
234
-
235
-
236
-
237
-
238
-
239
-
240
-
241
-
242
 |
 |

adidas Group
2011 Annual Report
TO OUR SHAREHOLDERS
55
2011
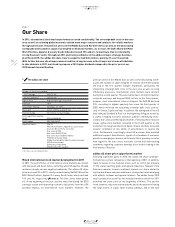
01.8 Our Share
the general market at the beginning of the second quarter, positive
analyst previews with regard to our first quarter results provided
stimulus to our share. As a result of better than expected top- and
bottom-line results, the share price closed at a then all-time high
on May 5, the day of the results release. Throughout the rest of the
quarter, several analyst upgrades and target price increases helped
to sustain positive momentum in an otherwise sluggish market, which
also continued into the third quarter. This resulted in the adidas AG
share reaching a new all-time high of € 57.42 on July 15
DIAGRAM 03
.
The first half year results as well as the more optimistic outlook for
2011 published in early August provided further support for our share
price in the following weeks. While international indices declined
significantly, the adidas AG share lost only slightly. However, during
September, share price losses accelerated due to a lack of positive
stimuli. At the beginning of the fourth quarter, an Investor Field Trip
to Moscow aimed at providing further insights into one of our three
key attack markets – Russia/CIS – triggered a strong positive share
price develop ment. The event strengthened analysts’ confidence in
our ability to strengthen our dominant market position as well as to
achieve our Route 2015 targets in that market. At the beginning of
November, our third quarter results, a further increase in our 2011
full year outlook as well as the publication of a sales and earnings
per share outlook for 2012 were well received by market participants.
However, in light of a generally weak market, this did not provide
further stimulus to our share price towards the end of the year. Never-
theless, the adidas AG share closed 2011 at € 50.26, representing a
3% increase and a significant outperformance versus the market.
This implies a market capitalisation of € 10.5 billion at the end of 2011
versus € 10.2 billion at the end of 2010
DIAGRAM 04
.
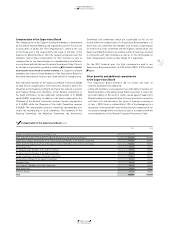
During 2011, the average daily trading volume of the adidas AG share on
all German stock exchanges (excluding bank trades) remained almost
unchanged at 1.2 million shares (2010: 1.2 million). The average daily
trading volume of the adidas AG share on alternative trading systems,
such as CHI-X, Turquoise and BATS Europe, remained at a high level
of 0.7 million shares per trading day, similar to 2010.
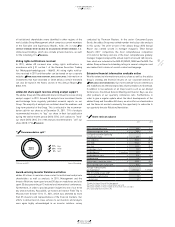
ADR performs in line with common stock
Since its launch on December 30, 2004, our Level 1 American
Depositary Receipt (ADR) facility has enjoyed great popularity among
American investors. Deutsche Bank Trust Company Americas runs our
Level 1 ADR Programme. Our Level 1 ADR closed 2011 at US $ 32.61,
almost unchanged versus the prior year (2010: US $ 32.60). The
unchanged Level 1 ADR price compared to the ordinary share price
increase was due to the appreciation of the US dollar during 2011.
The number of Level 1 ADRs outstanding significantly increased
to 10.0 million at year-end 2011 (2010: 6.4 million). The average
daily trading volume also increased 143% to 36,000 ADRs in 2011
(2010: 15,000). Since November 2007, the adidas AG ADR is quoted
on the OTCQX International Premier market, the highest over-the-
counter market tier. This electronic trading forum includes leading
international companies with substantial operating businesses
and credible disclosure policies. Further information on our ADR
Programme can be found on our website at :
WWW.ADIDAS-GROUP.COM/ADR
.
04 adidas AG market capitalisation at year-end (€ in millions)
2011 10,515
2010 10,229
2009 7,902
2008 5,252
2007 10,438
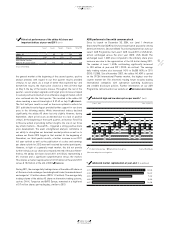
02 Historical performance of the adidas AG share and
important indices at year-end 2011 (in %)
1 year 3 years 5 years 10 years Since IPO
adidas AG 3 85 33 138 420
DAX-30 (15) 23 (11) 14 169
MSCI World Textiles,
Apparel & Luxury Goods (4) 110 32 203 228
Source: Bloomberg.
03 adidas AG high and low share prices per month 1) (in €)
| Jan. 1, 2011 Dec. 31, 2011 |
60
50
40
30-day moving average ■ High and low share prices Source: Bloomberg.
1) Based on daily Xetra closing prices.
48.94
49.35
47.65
50.26
53.50
54.95
57.42
51.19
49.82
52.31
52.65
52.06
44.75
45.65
43.22
44.65
49.89
49.00
51.79
44.11
44.25
43.95
48.10
47.89