Reebok 2011 Annual Report Download - page 188
Download and view the complete annual report
Please find page 188 of the 2011 Reebok annual report below. You can navigate through the pages in the report by either clicking on the pages listed below, or by using the keyword search tool below to find specific information within the annual report.-
 1
1 -
2
-
3
-
4
-
5
-
6
-
7
-
8
-
9
-
10
-
11
-
12
-
13
-
14
-
15
-
16
-
17
-
18
-
19
-
20
-
21
-
22
-
23
-
24
-
25
-
26
-
27
-
28
-
29
-
30
-
31
-
32
-
33
-
34
-
35
-
36
-
37
-
38
-
39
-
40
-
41
-
42
-
43
-
44
-
45
-
46
-
47
-
48
-
49
-
50
-
51
-
52
-
53
-
54
-
55
-
56
-
57
-
58
-
59
-
60
-
61
-
62
-
63
-
64
-
65
-
66
-
67
-
68
-
69
-
70
-
71
-
72
-
73
-
74
-
75
-
76
-
77
-
78
-
79
-
80
-
81
-
82
-
83
-
84
-
85
-
86
-
87
-
88
-
89
-
90
-
91
-
92
-
93
-
94
-
95
-
96
-
97
-
98
-
99
-
100
-
101
-
102
-
103
-
104
-
105
-
106
-
107
-
108
-
109
-
110
-
111
-
112
-
113
-
114
-
115
-
116
-
117
-
118
-
119
-
120
-
121
-
122
-
123
-
124
-
125
-
126
-
127
-
128
-
129
-
130
-
131
-
132
-
133
-
134
-
135
-
136
-
137
-
138
-
139
-
140
-
141
-
142
-
143
-
144
-
145
-
146
-
147
-
148
-
149
-
150
-
151
-
152
-
153
-
154
-
155
-
156
-
157
-
158
-
159
-
160
-
161
-
162
-
163
-
164
-
165
-
166
-
167
-
168
-
169
-
170
-
171
-
172
-
173
-
174
-
175
-
176
-
177
-
 178
178 -
 179
179 -
 180
180 -
 181
181 -
 182
182 -
 183
183 -
 184
184 -
 185
185 -
 186
186 -
 187
187 -
 188
188 -
 189
189 -
 190
190 -
 191
191 -
 192
192 -
 193
193 -
 194
194 -
 195
195 -
 196
196 -
 197
197 -
 198
198 -
199
-
200
-
201
-
202
-
203
-
204
-
205
-
206
-
207
-
208
-
209
-
210
-
211
-
212
-
213
-
214
-
215
-
216
-
217
-
218
-
219
-
220
-
221
-
222
-
223
-
224
-
225
-
226
-
227
-
228
-
229
-
230
-
231
-
232
-
233
-
234
-
235
-
236
-
237
-
238
-
239
-
240
-
241
-
242
 |
 |

adidas Group
2011 Annual Report
CONSOLIDATED FINANCIAL STATEMENTS
04.8 Notes
184
2011
184
2011
04.8
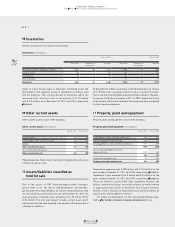
Inventories
Merchandise and finished goods are valued at the lower of cost or
net realisable value, which is the estimated selling price in the ordi-
nary course of business less the estimated costs of completion and
the estimated costs necessary to make the sale. Costs are determined
using a standard valuation method: the “average cost method”. Costs
of finished goods include cost of raw materials, direct labour and the
components of the manufacturing overheads which can reasonably
be attributed. The allocation of overheads is based on the planned
average utilisation. The net realisable value allowances are computed
consistently throughout the Group based on the age and expected
future sales of the items on hand.
Assets/liabilities classified as held for sale
Primarily non-current assets and liabilities expected to be recov-
ered principally through sale rather than through continuing use are
classified as held for sale. These are measured at the lower of their
carrying amount and fair value less costs to sell. A potential gain or
loss is offset against the carrying amount of the assets and liabilities
classified as held for sale. Assets classified as held for sale are not
depreciated.
Property, plant and equipment
Property, plant and equipment are measured at amortised cost. This
comprises any costs directly attributable to bringing the asset to the
condition necessary for it to be capable of operating in the manner
intended by Management less accumulated depreciation (except for
land and construction in progress) and accumulated impairment
losses. Depreciation is recognised over the estimated useful life
utilising the “straight-line method” and taking into account any poten-
tial residual value, except where the “declining-balance method” is
more appropriate in light of the actual utilisation pattern. Parts of an
item of property, plant and equipment with a cost that is significant in
relation to the total cost of the item are depreciated separately.
Estimated useful lives are as follows:
Estimated useful lives of property, plant and equipment
Years
Buildings and leasehold improvements 5 – 50
Technical equipment and machinery as well as other equipment
and furniture and fixtures 2 – 10
Expenditures for repairs and maintenance are expensed as incurred.
Renewals and improvements are capitalised and depreciated separ-
ately, if the recognition criteria are met.
Impairment losses
If facts and circumstances indicate that non-current assets (e.g. prop-
erty, plant and equipment, intangible assets including goodwill and
certain financial assets) might be impaired, the recoverable amount
is determined. It is measured at the higher of its fair value less costs
to sell and value in use. An impairment loss is recognised in other
operating expenses if the carrying amount exceeds the recoverable
amount. If there is an impairment loss for a cash-generating unit, first
the carrying amount of any goodwill allocated to the cash-generating
unit is reduced, and subsequently the other non-current assets of the
unit are reduced pro rata on the basis of the carrying amount of each
asset in the unit.
Irrespective of whether there is an impairment indication, intan-
gible assets with an indefinite useful life and goodwill acquired in
business combinations are tested annually for impairment.
An impairment loss recognised in goodwill is not reversible. With
respect to all other impaired assets, an impairment loss recognised
in prior periods is reversed affecting the income statement if there
has been a change in the estimates used to determine the recoverable
amount. An impairment loss is reversed only to the extent that the
asset’s carrying amount does not exceed the carrying amount that
would have been determined (net of depreciation or amortisation) if
no impairment loss had been recognised.
Leases
Under finance lease arrangements, the substantial risks and rewards
associated with an asset are transferred to the lessee. At the beginning
of the lease arrangement, the respective asset and a corresponding
liability are recognised at the fair value of the asset or, if lower, the
net present value of the minimum lease payments. For subsequent
measurement, minimum lease payments are apportioned between
the finance expense and the reduction of the outstanding liability. The
finance expense is allocated to each period during the lease term so as
to produce a constant periodic interest rate on the remaining balance
of the liability. In addition, depreciation and any impairment losses for
the associated assets are recognised. Depreciation is performed over
the lease term or, if shorter, over the useful life of the asset.
Under operating lease agreements, rent expenses are recognised
on a straight-line basis over the term of the lease.