Reebok 2011 Annual Report Download - page 213
Download and view the complete annual report
Please find page 213 of the 2011 Reebok annual report below. You can navigate through the pages in the report by either clicking on the pages listed below, or by using the keyword search tool below to find specific information within the annual report.-
 1
1 -
2
-
3
-
4
-
5
-
6
-
7
-
8
-
9
-
10
-
11
-
12
-
13
-
14
-
15
-
16
-
17
-
18
-
19
-
20
-
21
-
22
-
23
-
24
-
25
-
26
-
27
-
28
-
29
-
30
-
31
-
32
-
33
-
34
-
35
-
36
-
37
-
38
-
39
-
40
-
41
-
42
-
43
-
44
-
45
-
46
-
47
-
48
-
49
-
50
-
51
-
52
-
53
-
54
-
55
-
56
-
57
-
58
-
59
-
60
-
61
-
62
-
63
-
64
-
65
-
66
-
67
-
68
-
69
-
70
-
71
-
72
-
73
-
74
-
75
-
76
-
77
-
78
-
79
-
80
-
81
-
82
-
83
-
84
-
85
-
86
-
87
-
88
-
89
-
90
-
91
-
92
-
93
-
94
-
95
-
96
-
97
-
98
-
99
-
100
-
101
-
102
-
103
-
104
-
105
-
106
-
107
-
108
-
109
-
110
-
111
-
112
-
113
-
114
-
115
-
116
-
117
-
118
-
119
-
120
-
121
-
122
-
123
-
124
-
125
-
126
-
127
-
128
-
129
-
130
-
131
-
132
-
133
-
134
-
135
-
136
-
137
-
138
-
139
-
140
-
141
-
142
-
143
-
144
-
145
-
146
-
147
-
148
-
149
-
150
-
151
-
152
-
153
-
154
-
155
-
156
-
157
-
158
-
159
-
160
-
161
-
162
-
163
-
164
-
165
-
166
-
167
-
168
-
169
-
170
-
171
-
172
-
173
-
174
-
175
-
176
-
177
-
178
-
179
-
180
-
181
-
182
-
183
-
184
-
185
-
186
-
187
-
188
-
189
-
190
-
191
-
192
-
193
-
194
-
195
-
196
-
197
-
198
-
199
-
200
-
201
-
202
-
 203
203 -
 204
204 -
 205
205 -
 206
206 -
 207
207 -
 208
208 -
 209
209 -
 210
210 -
 211
211 -
 212
212 -
 213
213 -
 214
214 -
 215
215 -
 216
216 -
 217
217 -
 218
218 -
 219
219 -
 220
220 -
 221
221 -
 222
222 -
 223
223 -
224
-
225
-
226
-
227
-
228
-
229
-
230
-
231
-
232
-
233
-
234
-
235
-
236
-
237
-
238
-
239
-
240
-
241
-
242
 |
 |

adidas Group
2011 Annual Report
CONSOLIDATED FINANCIAL STATEMENTS
209
2011
209
2011
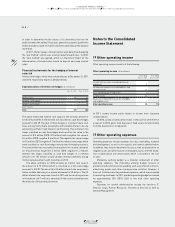
04.8 Notes Notes to the Consolidated Income Statement
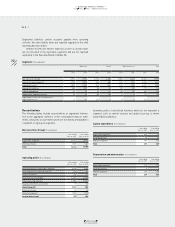
Depreciation and amortisation expense for tangible and intangible
assets (excluding goodwill) and impairment losses were € 252 million
and € 263 million for the years ending December 31, 2011 and 2010,
respectively. Thereof, € 3 million and € 3 million were recorded within
the cost of sales as they are directly assigned to the production costs.
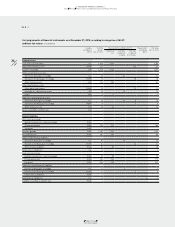
Other operating expenses (€ in millions)
Year ending
Dec. 31, 2011
Year ending
Dec. 31, 2010
Marketing working budget 1,361 1,288
Sales working budget 338 308
Marketing overhead 1) 402 380
Sales force 1) 1,653 1,496
Logistics 1) 678 617
Research and development 1) 115 102
Central administration 1) 977 855
Other operating expenses 5,524 5,046
Thereof:
Depreciation, amortisation and impairment losses 249 260
1) Including personnel and administration expenses.
31 Cost by nature
Expenses are presented by function according to the “cost of sales
method” in the income statement. Supplementary information on the
expenses by nature is detailed below.
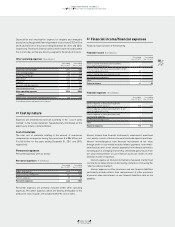
Cost of materials
The total cost of materials relating to the amount of inventories
recognised as an expense during the period was € 6.884 billion and
€ 6.165 billion for the years ending December 31, 2011 and 2010,
respectively.
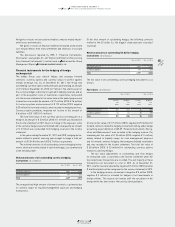
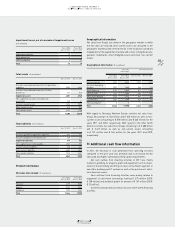
Personnel expenses
Personnel expenses were as follows:
Personnel expenses (€ in millions)
Year ending
Dec. 31, 2011
Year ending
Dec. 31, 2010
Wages and salaries 1,439 1,338
Social security contributions 152 132
Pension expenses 55 51
Personnel expenses 1,646 1,521
Personnel expenses are primarily included within other operating
expenses. Personnel expenses which are directly attributable to the
production costs of goods are included within the cost of sales.
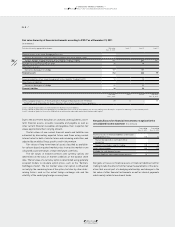
32 Financial income/financial expenses
Financial result consists of the following:
Financial income (€ in millions)
Year ending
Dec. 31, 2011
Year ending
Dec. 31, 2010
Interest income from financial instruments
measured at amortised cost 12 16
Interest income from financial instruments at fair
value through profit or loss 18 7
Interest income from non-financial assets 0 0
Net foreign exchange gains – 2
Other 1 0
Financial income 31 25
Financial expenses (€ in millions)
Year ending
Dec. 31, 2011
Year ending
Dec. 31, 2010
Interest expense on financial instruments
measured at amortised cost 108 112
Interest expense on financial instruments at fair
value through profit or loss 0 0
Interest expense on other provisions and
non-financial liabilities 0 0
Net foreign exchange losses 7 –
Other 0 1
Financial expenses 115 113
Interest income from financial instruments, measured at amortised
cost, mainly consists of interest income from bank deposits and loans.
Interest income/expense from financial instruments at fair value
through profit or loss mainly includes interest payments from invest-
ment funds as well as net interest payments from interest derivatives
not being part of a hedging relationship. Unrealised gains/losses from
fair value measurement of such financial assets are shown in other
financial income or expenses.
Interest expense on financial instruments measured at amortised
cost mainly includes interest on borrowings and effects from using the
“effective interest method”.
Interest expense on other provisions and non-financial liabilities
particularly includes effects from measurement of other provisions
at present value and interest on non-financial liabilities such as tax
payables.