Reebok 2011 Annual Report Download - page 138
Download and view the complete annual report
Please find page 138 of the 2011 Reebok annual report below. You can navigate through the pages in the report by either clicking on the pages listed below, or by using the keyword search tool below to find specific information within the annual report.-
 1
1 -
2
-
3
-
4
-
5
-
6
-
7
-
8
-
9
-
10
-
11
-
12
-
13
-
14
-
15
-
16
-
17
-
18
-
19
-
20
-
21
-
22
-
23
-
24
-
25
-
26
-
27
-
28
-
29
-
30
-
31
-
32
-
33
-
34
-
35
-
36
-
37
-
38
-
39
-
40
-
41
-
42
-
43
-
44
-
45
-
46
-
47
-
48
-
49
-
50
-
51
-
52
-
53
-
54
-
55
-
56
-
57
-
58
-
59
-
60
-
61
-
62
-
63
-
64
-
65
-
66
-
67
-
68
-
69
-
70
-
71
-
72
-
73
-
74
-
75
-
76
-
77
-
78
-
79
-
80
-
81
-
82
-
83
-
84
-
85
-
86
-
87
-
88
-
89
-
90
-
91
-
92
-
93
-
94
-
95
-
96
-
97
-
98
-
99
-
100
-
101
-
102
-
103
-
104
-
105
-
106
-
107
-
108
-
109
-
110
-
111
-
112
-
113
-
114
-
115
-
116
-
117
-
118
-
119
-
120
-
121
-
122
-
123
-
124
-
125
-
126
-
127
-
 128
128 -
 129
129 -
 130
130 -
 131
131 -
 132
132 -
 133
133 -
 134
134 -
 135
135 -
 136
136 -
 137
137 -
 138
138 -
 139
139 -
 140
140 -
 141
141 -
 142
142 -
 143
143 -
 144
144 -
 145
145 -
 146
146 -
 147
147 -
 148
148 -
149
-
150
-
151
-
152
-
153
-
154
-
155
-
156
-
157
-
158
-
159
-
160
-
161
-
162
-
163
-
164
-
165
-
166
-
167
-
168
-
169
-
170
-
171
-
172
-
173
-
174
-
175
-
176
-
177
-
178
-
179
-
180
-
181
-
182
-
183
-
184
-
185
-
186
-
187
-
188
-
189
-
190
-
191
-
192
-
193
-
194
-
195
-
196
-
197
-
198
-
199
-
200
-
201
-
202
-
203
-
204
-
205
-
206
-
207
-
208
-
209
-
210
-
211
-
212
-
213
-
214
-
215
-
216
-
217
-
218
-
219
-
220
-
221
-
222
-
223
-
224
-
225
-
226
-
227
-
228
-
229
-
230
-
231
-
232
-
233
-
234
-
235
-
236
-
237
-
238
-
239
-
240
-
241
-
242
 |
 |
adidas Group
2011 Annual Report
GROUP MANAGEMENT REPORT – FINANCIAL REVIEW
134
2011
03.2 Group Business Performance Financial Statements and Management Report of adidas AG
03.2
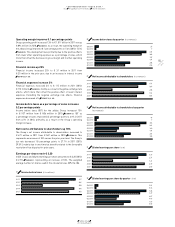
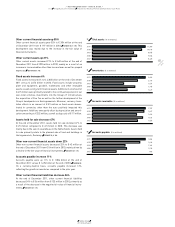
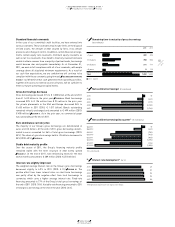
Other operating income declines 2%
In 2011, other operating income of adidas AG declined 2% to
€ 1.254 billion. This was primarily due to a decrease in income from
currency conversion and lower income derived from services provided
to other Group companies. The result also reflects the conversion of
the Reebok Germany business from commission agent to principal. In
the prior year, this business was still being conducted by adidas AG
as commission agent; as such, the company generated income by
passing the operational costs on to the principal. The conversion to
principal meant that the income derived from passing on costs were
no longer achieved in 2011.
Other operating expenses increase 10%
In 2011, other operating expenses for adidas AG rose 10% to
€ 2.125 billion (2010: € 1.931 billion). The increase is largely attrib-
utable to higher marketing expenditure. This includes an increase in
promotional and advertising expenditure to support sales growth in
Germany, and higher expenditure for global marketing to strengthen
the adidas brand at an international level. Losses from currency
conversion were also up, as was expenditure for legal and other
consultancy services.
Depreciation and amortisation increases due to
completion of Laces
Depreciation and amortisation for adidas AG rose € 12 million in 2011
to € 69 million, mainly as a result of the opening of the new “Laces”
office building in Herzogenaurach, Germany.
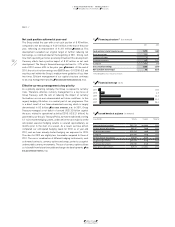
Loss from operations
In 2011, adidas AG recorded a loss from operations in the amount of
€ 9 million compared to a profit of € 77 million in the prior year. This
was mainly due to the increase in other operating expenses.
Financial result increases 25%
Net interest expense of adidas AG declined 9% to € 63 million in 2011
(2010: € 69 million). This positive development derives from interest
received from affiliated companies. At € 40 million, interest paid to
third parties increased € 1 million compared to the prior year.
Income from investments in affiliated companies increased
€ 58 million to € 147 million in 2011 from € 89 million in the prior year.
Profit and loss transfer agreements generated income of € 94 million
for adidas AG in 2011. As a result, the financial result of adidas AG
increased 25% to € 178 million from € 142 million in 2010.
Net income decreases 29%
Income from ordinary activities decreased 23% to € 169 million in
2011 from € 219 million in 2010, as increases in the financial result
were more than offset by the loss from operations. Net income for the
year after taxes of € 58 million was € 111 million (2010: € 157 million).
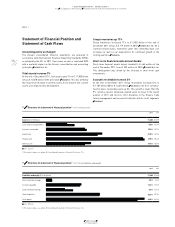
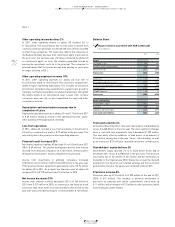
Balance Sheet
Total assets decline 4%
At the end of December 2011, total assets declined 4% to € 6.046 billion
versus € 6.265 billion in the prior year. The most significant changes
were in cash and cash equivalents, which decreased € 299 million.
This was partly offset by additions to fixed assets in an amount of
€ 54 million, mainly due to the new “Laces” office building, as well
as an increase of € 27 million in receivables and other current assets.
Shareholders’ equity declines 2%
Shareholders’ equity declined 2% to € 2.322 billion at the end of
December 2011 versus € 2.378 billion in the prior year. The decrease
was mainly due to the decline in net income and the distribution of
dividends for the financial year 2010. Taking into account the dividend
distribution from the prior year retained earnings and the net income
generated for the year, the equity ratio remained stable at 38%.
Provisions increase 8%
Provisions were up € 24 million to € 339 million at the end of 2011
(2010: € 315 million). This increase is primarily attributable to
provisions for pensions and similar commitments, which were up
€ 11 million, and an increase of € 13 million in other provisions, which
were mainly personnel-related.
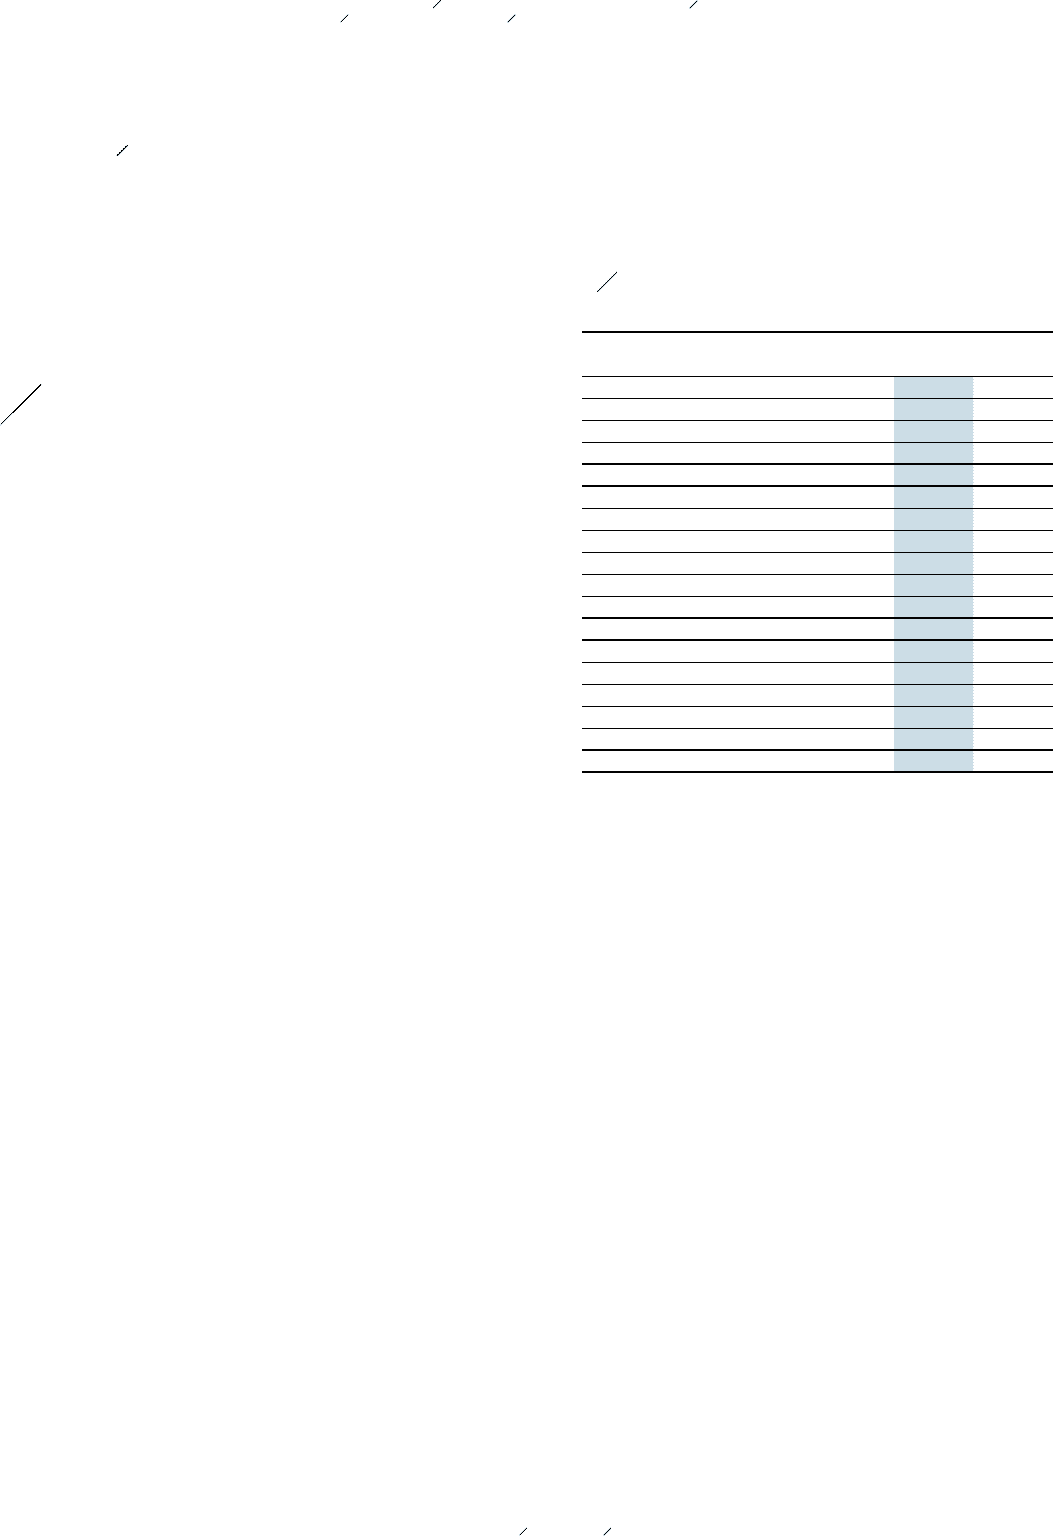
56 Balance sheet in accordance with HGB (condensed)
(€ in millions)
2011 2010
Assets
Intangible assets 154 161
Property, plant and equipment 255 229
Financial assets 3,429 3,395
Fixed assets 3,838 3,785
Inventories 30 21
Receivables and other assets 1,767 1,740
Cash and cash equivalents, securities 383 682
Current assets 2,180 2,443
Prepaid expenses 28 37
Total assets 6,046 6,265
Equity and liabilities
Shareholders’ equity 2,322 2,378
Provisions 339 315
Liabilities and other items 3,385 3,572
Total equity and liabilities 6,046 6,265