Reebok 2011 Annual Report Download - page 124
Download and view the complete annual report
Please find page 124 of the 2011 Reebok annual report below. You can navigate through the pages in the report by either clicking on the pages listed below, or by using the keyword search tool below to find specific information within the annual report.-
 1
1 -
2
-
3
-
4
-
5
-
6
-
7
-
8
-
9
-
10
-
11
-
12
-
13
-
14
-
15
-
16
-
17
-
18
-
19
-
20
-
21
-
22
-
23
-
24
-
25
-
26
-
27
-
28
-
29
-
30
-
31
-
32
-
33
-
34
-
35
-
36
-
37
-
38
-
39
-
40
-
41
-
42
-
43
-
44
-
45
-
46
-
47
-
48
-
49
-
50
-
51
-
52
-
53
-
54
-
55
-
56
-
57
-
58
-
59
-
60
-
61
-
62
-
63
-
64
-
65
-
66
-
67
-
68
-
69
-
70
-
71
-
72
-
73
-
74
-
75
-
76
-
77
-
78
-
79
-
80
-
81
-
82
-
83
-
84
-
85
-
86
-
87
-
88
-
89
-
90
-
91
-
92
-
93
-
94
-
95
-
96
-
97
-
98
-
99
-
100
-
101
-
102
-
103
-
104
-
105
-
106
-
107
-
108
-
109
-
110
-
111
-
112
-
113
-
 114
114 -
 115
115 -
 116
116 -
 117
117 -
 118
118 -
 119
119 -
 120
120 -
 121
121 -
 122
122 -
 123
123 -
 124
124 -
 125
125 -
 126
126 -
 127
127 -
 128
128 -
 129
129 -
 130
130 -
 131
131 -
 132
132 -
 133
133 -
 134
134 -
135
-
136
-
137
-
138
-
139
-
140
-
141
-
142
-
143
-
144
-
145
-
146
-
147
-
148
-
149
-
150
-
151
-
152
-
153
-
154
-
155
-
156
-
157
-
158
-
159
-
160
-
161
-
162
-
163
-
164
-
165
-
166
-
167
-
168
-
169
-
170
-
171
-
172
-
173
-
174
-
175
-
176
-
177
-
178
-
179
-
180
-
181
-
182
-
183
-
184
-
185
-
186
-
187
-
188
-
189
-
190
-
191
-
192
-
193
-
194
-
195
-
196
-
197
-
198
-
199
-
200
-
201
-
202
-
203
-
204
-
205
-
206
-
207
-
208
-
209
-
210
-
211
-
212
-
213
-
214
-
215
-
216
-
217
-
218
-
219
-
220
-
221
-
222
-
223
-
224
-
225
-
226
-
227
-
228
-
229
-
230
-
231
-
232
-
233
-
234
-
235
-
236
-
237
-
238
-
239
-
240
-
241
-
242
 |
 |
adidas Group
2011 Annual Report
GROUP MANAGEMENT REPORT – FINANCIAL REVIEW
120
2011
Latin America’s sporting goods industry records
strong momentum
In Latin America, solid consumer spending and retail activity
supported growth in the industry, which increased at a high-single-
digit rate in 2011. This was despite the tough comparisons from
lapping the positive effect of the 2010 FIFA World Cup. The 2011 Copa
América, held in Argentina, supported spending on sporting goods,
helping to offset this effect.
adidas Group and competitors outperform
economic environment
adidas Group revenues and profitability as well as those of many
competitors and retailers increased in 2011. In most regions, sales of
our Group and other major sporting goods companies grew at a higher
rate than GDP and overall consumer spending.
03.2 Group Business Performance Economic and Sector Development
03.2
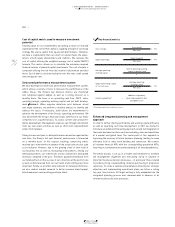
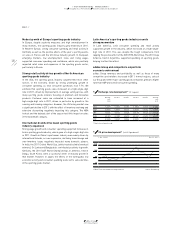
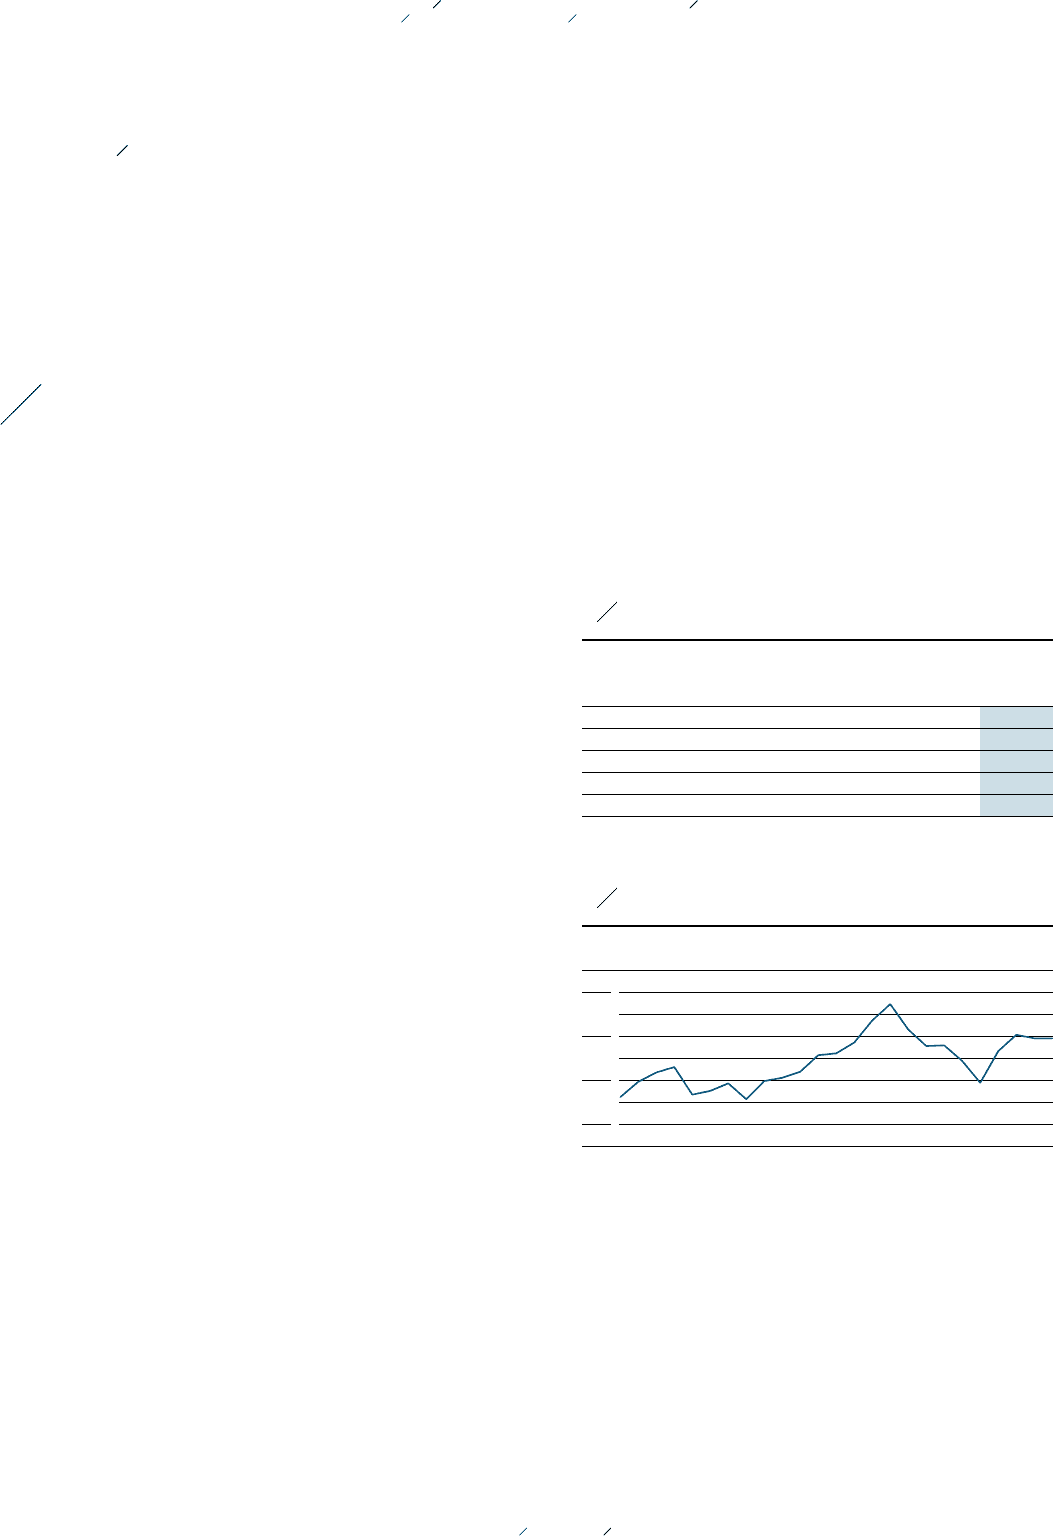
06 Oil price development 1) (in US $ per barrel)
| Jan. 1, 2010 Dec. 31, 2011 |
120
100
80
60
1) West Texas Intermediate Cushing crude oil. Source: Bloomberg.
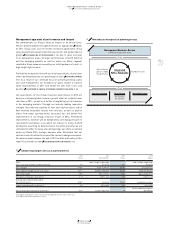
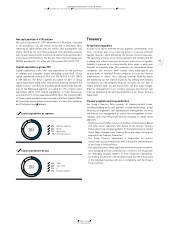
05 Exchange rate development 1) (€ 1 equals)
Average
rate
2010
Q1 2011 Q2 2011 Q3 2011 Q4 2011 Average
rate
2011
USD 1.3279 1.4207 1.4453 1.3503 1.2939 1.3922
GBP 0.8584 0.8837 0.9026 0.8667 0.8353 0.8678
JPY 116.56 117.61 116.25 103.79 100.20 111.04
RUB 40.303 40.285 40.400 43.041 41.659 40.871
CNY 8.9885 9.3147 9.3534 8.5810 8.1527 9.0000
1) Spot rates at quarter-end.
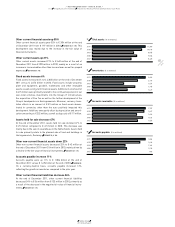
Modest growth of Europe’s sporting goods industry
In Europe, despite austerity measures and high unemployment in
many markets, the sporting goods industry grew modestly in 2011.
In Western Europe, strong consumer spending and retail activity in
Germany as well as the positive effects of the year’s sporting events
on sales in France and the UK drove industry growth. In European
emerging markets, low unemployment rates and rising wages
supported consumer spending and confidence, which also positively
impacted retail sales and expansion of the sporting goods sector,
particularly in Russia.
Strong retail activity drives growth of North American
sporting goods industry
In the USA, the sporting goods industry outperformed most other
sectors of the economy, driven by strong underlying growth in
consumer spending, as total consumer purchases rose 7.7%. We
estimate that sporting goods sales increased at a high-single-digit
rate in 2011, driven by improvements in average selling prices, with
many sporting goods retailers focusing on premium and innovative
products. Footwear sales are estimated to have increased at a
high-single-digit rate in 2011, driven in particular by growth in the
running and training categories. However, the US toning market saw
a significant decline in 2011, with the effect of inventory overhang and
extensive discounting negatively impacting this category. The NBA
lockout and the delayed start of the season had little impact on sales
in the basketball category.
International brands drive Asian sporting goods
industry expansion
Strong wage growth and consumer spending supported increases in
Asia’s sporting goods industry, which grew at a high-single-digit rate
in 2011. Growth in China’s sportswear industry was mainly driven by
international brands, as over-expansion, declining brand image and
over-inventory issues negatively impacted many domestic players.
In India, the 2011 Cricket World Cup, jointly hosted by India (eventual
winners), Sri Lanka and Bangladesh, contributed positively to growth.
Similarly, the 2011 IAAF World Championships in Athletics, held in
Daegu, South Korea, were a successful driver of industry growth in
that market. However, in Japan, the effects of the earthquake, low
economic activity and consumer spending levels led to sales declines
in the sporting goods market.