Red Lobster 2013 Annual Report Download - page 67
Download and view the complete annual report
Please find page 67 of the 2013 Red Lobster annual report below. You can navigate through the pages in the report by either clicking on the pages listed below, or by using the keyword search tool below to find specific information within the annual report.-
 1
1 -
2
-
3
-
4
-
5
-
6
-
7
-
8
-
9
-
10
-
11
-
12
-
13
-
14
-
15
-
16
-
17
-
18
-
19
-
20
-
21
-
22
-
23
-
24
-
25
-
26
-
27
-
28
-
29
-
30
-
31
-
32
-
33
-
34
-
35
-
36
-
37
-
38
-
39
-
40
-
41
-
42
-
43
-
44
-
45
-
46
-
47
-
48
-
49
-
50
-
51
-
52
-
53
-
54
-
55
-
56
-
 57
57 -
 58
58 -
 59
59 -
 60
60 -
 61
61 -
 62
62 -
 63
63 -
 64
64 -
 65
65 -
 66
66 -
 67
67 -
 68
68 -
 69
69 -
 70
70 -
 71
71 -
 72
72 -
 73
73 -
 74
74
 |
 |

Notes to Consolidated Financial Statements
Darden
Darden Restaurants, Inc. 2013 Annual Report 63
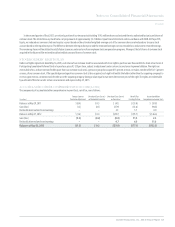
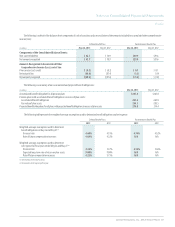
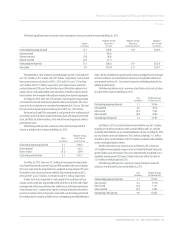
The following table presents a summary of our stock option activity as of and for the year ended May 26, 2013:
Weighted-Average Weighted-Average Aggregate
Options Exercise Price Remaining Intrinsic Value
(in millions) Per Share Contractual Life (Yrs) (in millions)
Outstanding beginning of period 12.3 $36.05 5.58 $209.3
Options granted 1.7 49.03
Options exercised (2.0) 28.96
Options canceled (0.4) 45.11
Outstanding end of period 11.6 $38.81 5.47 $162.6
Exercisable 6.9 $33.84 3.73 $130.7
The total intrinsic value of options exercised during fiscal 2013, 2012 and 2011
was $47.1 million, $49.7 million and $49.9 million, respectively. Cash received
from option exercises during fiscal 2013, 2012 and 2011 was $57.0 million,
$62.9 million and $55.7 million, respectively. Stock options have a maximum
contractual period of 10 years from the date of grant. We settle employee stock
option exercises with authorized but unissued shares of Darden common stock or
treasury shares we have acquired through our ongoing share repurchase program.
As of May 26, 2013, there was $32.8 million of unrecognized compensation
cost related to unvested stock options granted under our stock plans. This cost is
expected to be recognized over a weighted-average period of 2.4 years. The total
fair value of stock options that vested during fiscal 2013 was $19.6 million.
Restricted stock and RSUs are granted at a value equal to the market price of
our common stock on the date of grant. Restrictions lapse with regard to restricted
stock, and RSUs are settled in shares, at the end of their vesting periods, which is
generally four years.
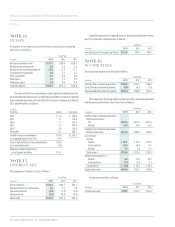
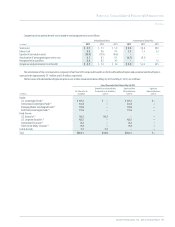
The following table presents a summary of our restricted stock and RSU
activity as of and for the fiscal year ended May 26, 2013:
Weighted-Average
Shares Grant Date Fair
(in millions) Value Per Share
Outstanding beginning of period 0.3 $39.63
Shares granted 0.1 50.23
Shares vested (0.2) 36.49
Outstanding end of period 0.2 $35.13
As of May 26, 2013, there was $5.1 million of unrecognized compensation
cost related to unvested restricted stock and RSUs granted under our stock plans.
This cost is expected to be recognized over a weighted-average period of 2.9 years.
The total fair value of restricted stock and RSUs that vested during fiscal 2013,
2012 and 2011 was $5.5 million, $10.0 million and $9.1 million, respectively.
Darden stock units are granted at a value equal to the market price of our
common stock on the date of grant and will be settled in cash at the end of their
vesting periods, which range between four and five years, at the then market price
of our common stock. Compensation expense is measured based on the market
price of our common stock each period, is amortized over the vesting period and
the vested portion is carried as a liability on our accompanying consolidated balance
sheets. We also entered into equity forward contracts to hedge the risk of changes
in future cash flows associated with the unvested, unrecognized Darden stock
unitsgranted(seeNote10–DerivativeInstrumentsandHedgingActivitiesfor
additional information).
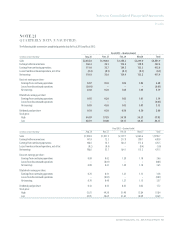
The following table presents a summary of our Darden stock unit activity as
of and for the fiscal year ended May 26, 2013:
Units Weighted-Average
(in millions) Fair Value Per Unit
Outstanding beginning of period 2.1 $53.06
Units granted 0.6 50.76
Units vested (0.3) 51.92
Units canceled (0.2) 42.86
Outstanding end of period 2.2 $52.83
As of May 26, 2013, our total Darden stock unit liability was $61.1 million,
including $19.9 million recorded in other current liabilities and $41.2 million
recorded in other liabilities on our consolidated balance sheets. As of May 27, 2012,
our total Darden stock unit liability was $50.3 million, including $11.1 million
recorded in other current liabilities and $39.2 million recorded in other liabilities
on our consolidated balance sheets.
Based on the value of our common stock as of May 26, 2013, there was
$43.0 million of unrecognized compensation cost related to Darden stock units
granted under our incentive plans. This cost is expected to be recognized over a
weighted-average period of 2.8 years. Darden stock units with a fair value of
$13.4 million vested during fiscal 2013.
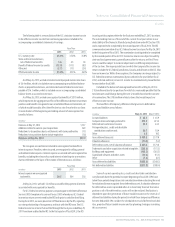
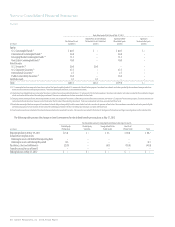
The following table presents a summary of our performance stock unit
activity as of and for the fiscal year ended May 26, 2013:
Units Weighted-Average
(in millions) Fair Value Per Unit
Outstanding beginning of period 1.1 $39.33
Units granted 0.3 49.58
Units vested (0.4) 51.97
Units canceled (0.1) 42.03
Outstanding end of period 0.9 $36.83