Red Lobster 2013 Annual Report Download - page 64
Download and view the complete annual report
Please find page 64 of the 2013 Red Lobster annual report below. You can navigate through the pages in the report by either clicking on the pages listed below, or by using the keyword search tool below to find specific information within the annual report.-
 1
1 -
2
-
3
-
4
-
5
-
6
-
7
-
8
-
9
-
10
-
11
-
12
-
13
-
14
-
15
-
16
-
17
-
18
-
19
-
20
-
21
-
22
-
23
-
24
-
25
-
26
-
27
-
28
-
29
-
30
-
31
-
32
-
33
-
34
-
35
-
36
-
37
-
38
-
39
-
40
-
41
-
42
-
43
-
44
-
45
-
46
-
47
-
48
-
49
-
50
-
51
-
52
-
53
-
 54
54 -
 55
55 -
 56
56 -
 57
57 -
 58
58 -
 59
59 -
 60
60 -
 61
61 -
 62
62 -
 63
63 -
 64
64 -
 65
65 -
 66
66 -
 67
67 -
 68
68 -
 69
69 -
 70
70 -
 71
71 -
 72
72 -
 73
73 -
 74
74
 |
 |

Notes to Consolidated Financial Statements
Darden
60 Darden Restaurants, Inc. 2013 Annual Report
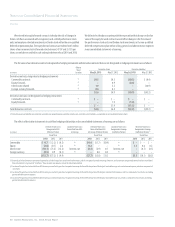
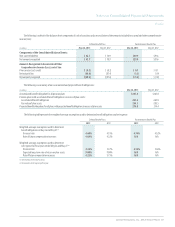
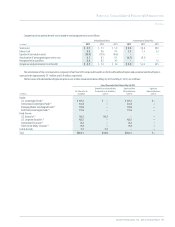
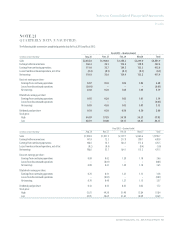
Items Measured at Fair Value at May 27, 2012
Quoted Prices in Active Market Significant Other Significant
Fair Value of Assets for Identical Assets (Liabilities) Observable Inputs Unobservable Inputs
(In millions) (Liabilities) (Level 1) (Level 2) (Level 3)
Equity:
U.S. Commingled Funds (1) $ 80.5 $– $ 80.5 $–
International Commingled Funds (2) 26.8 – 26.8 –
Emerging Market Commingled Funds (3) 11.3 – 11.3 –
Real Estate Commingled Funds (4) 10.0 – 10.0 –
Fixed-Income:
U.S. Treasuries (5) 20.0 20.0 – –
U.S. Corporate Securities (5) 37.7 – 37.7 –
International Securities (5) 2.7 – 2.7 –
Public Sector Utility Securities (5) 10.4 – 10.4 –
Cash&Accruals 4.1 4.1 – –
Total $203.5 $24.1 $179.4 $–
(1) U.S. commingled funds are comprised of investments in funds that purchase publicly traded U.S. common stock for total return purposes. Investments are valued at unit values provided by the investment managers which are
based on the fair value of the underlying investments. There are no redemption restrictions associated with these funds.
(2) International commingled funds are comprised of investments in funds that purchase publicly traded non-U.S. common stock for total return purposes. Investments are valued at unit values provided by the investment managers
which are based on the fair value of the underlying investments. There are no redemption restrictions associated with these funds.
(3) Emerging market commingled funds and developed market securities are comprised of investments in funds that purchase publicly traded common stock of non-U.S. companies for total return purposes. Funds are valued at unit
values provided by the investment managers which are based on the fair value of the underlying investments. There are no redemption restrictions associated with these funds.
(4) Real estate commingled funds are comprised of investments in funds that purchase publicly traded common stock of real estate securities for purposes of total return. These investments are valued at unit values provided by the
investment managers which are based on the fair value of the underlying investments. There are no redemption restrictions associated with these funds.
(5) Fixed-income securities are comprised of investments in government and corporate debt securities. These securities are valued by the trustee at closing prices from national exchanges or pricing vendors on the valuation date.
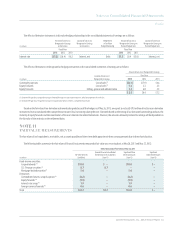
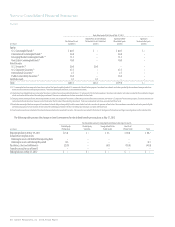
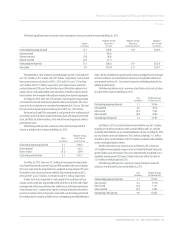
The following table presents the changes in Level 3 investments for the defined benefit pension plans at May 27, 2012:
Fair Value Measurements Using Significant Unobservable Inputs (Level 3)
Private Equity Private Equity Energy & Real Estate Real Asset
(in millions)
Partnerships Securities Public Sector Private Funds Total
BeginningbalanceatMay29,2011 $25.6 $– $4.3 $10.8 $40.7
Actual return on plan assets:
Relatingtoassetsstillheldatthereportingdate – – – – –
Relatingtoassetssoldduringtheperiod 0.3 – – – 0.3
Purchases,salesandsettlements (25.9) – (4.3) (10.8) (41.0)
Transfersinand/oroutofLevel3 – – – – –
EndingbalanceatMay27,2012 $ – $– $ – $ – $ –