Red Lobster 2013 Annual Report Download - page 39
Download and view the complete annual report
Please find page 39 of the 2013 Red Lobster annual report below. You can navigate through the pages in the report by either clicking on the pages listed below, or by using the keyword search tool below to find specific information within the annual report.-
 1
1 -
2
-
3
-
4
-
5
-
6
-
7
-
8
-
9
-
10
-
11
-
12
-
13
-
14
-
15
-
16
-
17
-
18
-
19
-
20
-
21
-
22
-
23
-
24
-
25
-
26
-
27
-
28
-
 29
29 -
 30
30 -
 31
31 -
 32
32 -
 33
33 -
 34
34 -
 35
35 -
 36
36 -
 37
37 -
 38
38 -
 39
39 -
 40
40 -
 41
41 -
 42
42 -
 43
43 -
 44
44 -
 45
45 -
 46
46 -
 47
47 -
 48
48 -
 49
49 -
50
-
51
-
52
-
53
-
54
-
55
-
56
-
57
-
58
-
59
-
60
-
61
-
62
-
63
-
64
-
65
-
66
-
67
-
68
-
69
-
70
-
71
-
72
-
73
-
74
 |
 |

Management’s Discussion and Analysis
of Financial Condition and Results of Operations
Darden
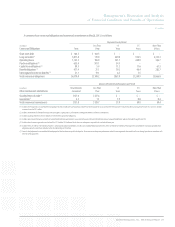
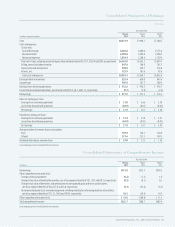
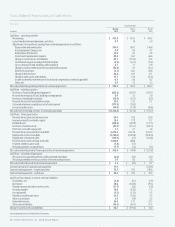
Consolidated Statements of Earnings
Darden
Fiscal Year Ended
May 26, May 27, May 29,
(in millions, except per share data) 2013 2012 2011
Sales $8,551.9 $7,998.7 $7,500.2
Costs and expenses:
Cost of sales:
Food and beverage 2,628.6 2,460.6 2,173.6
Restaurant labor 2,698.0 2,502.0 2,396.9
Restaurant expenses 1,334.4 1,200.6 1,129.0
Total cost of sales, excluding restaurant depreciation and amortization of $373.7, $326.9 and $295.6, respectively $6,661.0 $6,163.2 $5,699.5
Selling, general and administrative 847.8 746.8 742.7
Depreciation and amortization 394.8 349.1 316.8
Interest, net 125.9 101.6 93.6
Total costs and expenses $8,029.5 $7,360.7 $6,852.6
Earnings before income taxes 522.4 638.0 647.6
Income taxes 109.8 161.5 168.9
Earnings from continuing operations $ 412.6 $ 476.5 $ 478.7
Losses from discontinued operations, net of tax benefit of $0.4, $0.7, and $1.5, respectively (0.7) (1.0) (2.4)
Net earnings $ 411.9 $ 475.5 $ 476.3
Basic net earnings per share:
Earnings from continuing operations $ 3.20 $ 3.66 $ 3.50
Losses from discontinued operations (0.01) (0.01) (0.02)
Net earnings $ 3.19 $ 3.65 $ 3.48
Diluted net earnings per share:
Earnings from continuing operations $ 3.14 $ 3.58 $ 3.41
Losses from discontinued operations (0.01) (0.01) (0.02)
Net earnings $ 3.13 $ 3.57 $ 3.39
Average number of common shares outstanding:
Basic 129.0 130.1 136.8
Diluted 131.6 133.2 140.3
Dividends declared per common share $ 2.00 $ 1.72 $ 1.28
See accompanying notes to consolidated financial statements.
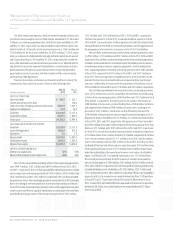
Consolidated Statements of Comprehensive Income
Fiscal Year Ended
May 26, May 27, May 29,
(in millions) 2013 2012 2011
Net earnings $411.9 $475.5 $476.3
Other comprehensive income (loss):
Foreign currency adjustment (0.2) (1.2) 1.8
Change in fair value of marketable securities, net of tax expense (benefit) of $0.1, $0.1 and $(0.1), respectively (0.2) (0.1) 0.2
Change in fair value of derivatives and amortization of unrecognized gains and losses on derivatives,
net of tax expense (benefit) of $0.6, $27.8 and $4.8, respectively (4.1) (45.6) (5.2)
Net unamortized gain (loss) arising during period, including amortization of unrecognized net actuarial loss,
net of tax expense (benefit) of $(11.3), $24.8 and $(9.0), respectively 18.3 (39.9) 14.5
Other comprehensive income (loss) $ 13.8 $ (86.8) $ 11.3
Total comprehensive income $425.7 $388.7 $487.6
See accompanying notes to consolidated financial statements.
Darden Restaurants, Inc. 2013 Annual Report 35