Red Lobster 2013 Annual Report Download - page 56
Download and view the complete annual report
Please find page 56 of the 2013 Red Lobster annual report below. You can navigate through the pages in the report by either clicking on the pages listed below, or by using the keyword search tool below to find specific information within the annual report.-
 1
1 -
2
-
3
-
4
-
5
-
6
-
7
-
8
-
9
-
10
-
11
-
12
-
13
-
14
-
15
-
16
-
17
-
18
-
19
-
20
-
21
-
22
-
23
-
24
-
25
-
26
-
27
-
28
-
29
-
30
-
31
-
32
-
33
-
34
-
35
-
36
-
37
-
38
-
39
-
40
-
41
-
42
-
43
-
44
-
45
-
 46
46 -
 47
47 -
 48
48 -
 49
49 -
 50
50 -
 51
51 -
 52
52 -
 53
53 -
 54
54 -
 55
55 -
 56
56 -
 57
57 -
 58
58 -
 59
59 -
 60
60 -
 61
61 -
 62
62 -
 63
63 -
 64
64 -
 65
65 -
 66
66 -
67
-
68
-
69
-
70
-
71
-
72
-
73
-
74
 |
 |

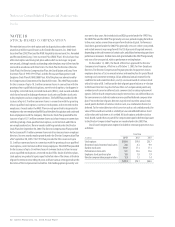
Notes to Consolidated Financial Statements
Darden
52 Darden Restaurants, Inc. 2013 Annual Report
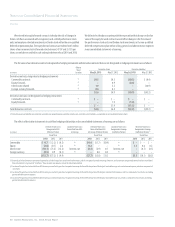
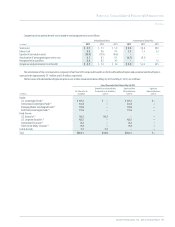
Items Measured at Fair Value at May 27, 2012
Quoted Prices in Active Market Significant Other Significant
Fair Value of Assets for Identical Assets (Liabilities) Observable Inputs Unobservable Inputs
(in millions) (Liabilities) (Level 1) (Level 2) (Level 3)
Fixed-income securities:
Corporate bonds (1) $14.5 $ – $14.5 $–
U.S. Treasury securities (2) 13.3 13.3 – –
Mortgage-backed securities (1) 9.9 – 9.9 –
Derivatives:
Commodities futures, swaps & options (3) (0.1) – (0.1) –
Equity forwards (4) 2.8 – 2.8 –
Interest rate locks & swaps (5) (41.7) – (41.7) –
Foreign currency forwards (6) 0.5 – 0.5 –
Total $ (0.8) $13.3 $(14.1) $–
(1) The fair value of these securities is based on closing market prices of the investments, when applicable, or, alternatively, valuations utilizing market data and other observable inputs, inclusive of the risk of nonperformance.
(2) The fair value of our U.S. Treasury securities is based on closing market prices.
(3) The fair value of our commodities futures, swaps and options is based on closing market prices of the contracts, inclusive of the risk of nonperformance.
(4) The fair value of our equity forwards is based on the closing market value of Darden stock, inclusive of the risk of nonperformance.
(5) The fair value of our interest rate lock and swap agreements is based on current and expected market interest rates, inclusive of the risk of nonperformance.
(6) The fair value of our foreign currency forward contracts is based on closing forward exchange market prices, inclusive of the risk of nonperformance.
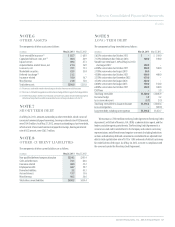
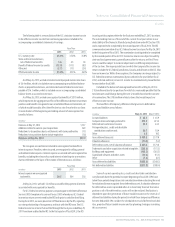
The carrying value and fair value of long-term debt as of May 26, 2013, was $2.50 billion and $2.40 billion, respectively. The carrying value and fair value of long-term
debt, including the amounts included in current liabilities, as of May 27, 2012, was $1.80 billion and $1.99 billion, respectively. The fair value of long-term debt is determined
based on market prices or, if market prices are not available, the present value of the underlying cash flows discounted at our incremental borrowing rates.
Adjustments to the fair values of non-financial assets measured at fair value on a non-recurring basis as of May 26, 2013 and May 27, 2012 were generally related
to impairments of property to be disposed of and were not material.
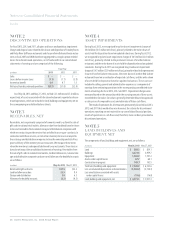
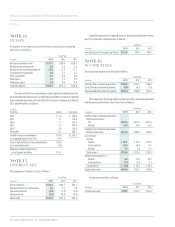
NOTE 12
FINANCIAL INSTRUMENTS
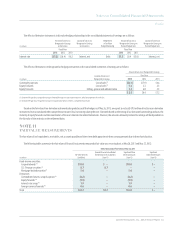
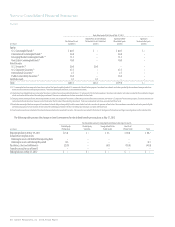
Marketable securities are carried at fair value and consist of available-for-sale
securities related to insurance funding requirements for our workers’ compensa-
tion and general liability claims. The following table summarizes cost and market
value for our securities that qualify as available-for-sale as of May 26, 2013:
Gross Gross
Unrealized Unrealized Market
(in millions)
Cost Gains Losses Value
Available-for-salesecurities $24.1 $0.2 $– $24.3
Earnings include insignificant realized gains and loss from sales of available-
for-sale securities. At May 26, 2013, the scheduled maturities of our available-for-sale
securities are as follows:
Market
(in millions)
Cost Value
Less than 1 year $ 2.0 $ 2.0
1 to 3 years 13.9 14.1
3 to 5 years 8.2 8.2
Total $24.1 $24.3
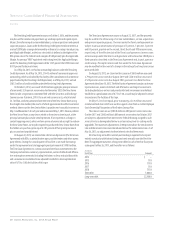
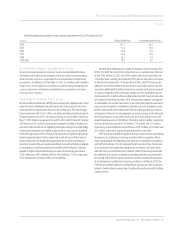
NOTE 13
STOCKHOLDERS’ EQUITY
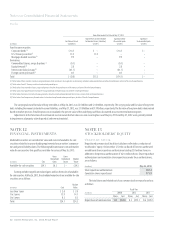
TREASURY STOCK
Repurchased common stock has historically been reflected as a reduction of
stockholders’ equity. On December 17, 2010, our Board of Directors authorized
an additional share repurchase authorization totaling 25.0 million shares in
addition to the previous authorization of 162.4 million shares. Share repurchase
authorizations and cumulative share repurchases under these authorizations,
are as follows:
(in millions)
May 26, 2013
Share repurchase authorizations 187.4
Cumulative shares repurchased 171.9
The total shares and related cost of our common stock we repurchased was
as follows:
Fiscal Year
(in millions)
2013 2012 2011
Shares Cost Shares Cost Shares Cost
Repurchases of common stock 1.0 $52.4 8.2 $375.1 8.6 $385.5