Red Lobster 2013 Annual Report Download - page 42
Download and view the complete annual report
Please find page 42 of the 2013 Red Lobster annual report below. You can navigate through the pages in the report by either clicking on the pages listed below, or by using the keyword search tool below to find specific information within the annual report.-
 1
1 -
2
-
3
-
4
-
5
-
6
-
7
-
8
-
9
-
10
-
11
-
12
-
13
-
14
-
15
-
16
-
17
-
18
-
19
-
20
-
21
-
22
-
23
-
24
-
25
-
26
-
27
-
28
-
29
-
30
-
31
-
 32
32 -
 33
33 -
 34
34 -
 35
35 -
 36
36 -
 37
37 -
 38
38 -
 39
39 -
 40
40 -
 41
41 -
 42
42 -
 43
43 -
 44
44 -
 45
45 -
 46
46 -
 47
47 -
 48
48 -
 49
49 -
 50
50 -
 51
51 -
 52
52 -
53
-
54
-
55
-
56
-
57
-
58
-
59
-
60
-
61
-
62
-
63
-
64
-
65
-
66
-
67
-
68
-
69
-
70
-
71
-
72
-
73
-
74
 |
 |

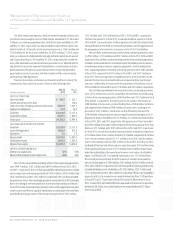
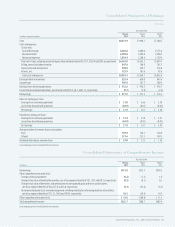
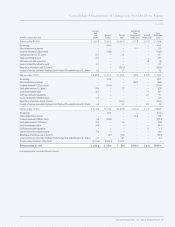
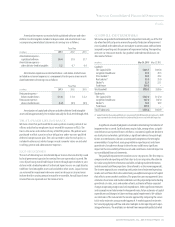
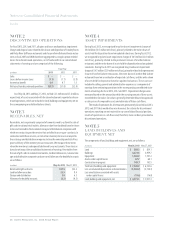
Consolidated Statements of Cash Flows
Darden
Fiscal Year Ended
May 26, May 27, May 29,
(in millions) 2013 2012 2011
Cashflows–operatingactivities
Net earnings $ 411.9 $ 475.5 $ 476.3
Losses from discontinued operations, net of tax 0.7 1.0 2.4
Adjustments to reconcile net earnings from continuing operations to cash flows:
Depreciation and amortization 394.8 349.1 316.8
Asset impairment charges, net 0.8 0.5 4.7
Amortization of loan costs 13.0 6.7 2.8
Stock-based compensation expense 49.3 56.1 66.6
Change in current assets and liabilities 40.1 (191.4) 12.2
Contributions to pension and postretirement plan (3.2) (22.7) (13.2)
Loss on disposal of land, buildings and equipment 8.1 7.1 6.9
Change in cash surrender value of trust-owned life insurance (16.8) 4.1 (13.7)
Deferred income taxes (2.1) 36.1 28.8
Change in deferred rent 26.8 18.5 17.1
Change in other assets and liabilities 17.1 15.8 (15.4)
Income tax benefits from exercise of stock-based compensation credited to goodwill 0.1 0.6 0.2
Other, net 8.9 5.2 2.2
Net cash provided by operating activities of continuing operations $ 949.5 $ 762.2 $ 894.7
Cashflows–investingactivities
Purchases of land, buildings and equipment (685.6) (639.7) (547.7)
Proceeds from disposal of land, buildings and equipment 0.4 3.3 7.0
Purchases of marketable securities (12.9) (32.1) (6.5)
Proceeds from sale of marketable securities 26.0 21.3 5.1
Cash used in business acquisitions, net of cash acquired (577.4) (58.5) –
Increase in other assets (40.9) (15.9) (10.6)
Net cash used in investing activities of continuing operations $(1,290.4) $ (721.6) $ (552.7)
Cashflows–financingactivities
Proceeds from issuance of common stock 64.4 70.2 63.0
Income tax benefits credited to equity 13.6 17.9 17.7
Dividends paid (258.2) (223.9) (175.5)
Purchases of common stock (52.4) (375.1) (385.5)
ESOP note receivable repayments 1.1 2.1 1.8
Proceeds from issuance of short-term debt 2,670.3 2,321.0 1,454.9
Repayments of short-term debt (2,768.4) (2,243.8) (1,269.4)
Repayments of long-term debt (355.9) (2.1) (226.8)
Proceeds from issuance of long-term debt 1,050.0 400.0 –
Payment of debt issuance costs (7.4) (5.1) –
Principal payments on capital leases (1.7) (1.6) (1.2)
Net cash provided by (used in) financing activities of continuing operations $ 355.4 $ (40.4) $ (521.0)
Cashflows–discontinuedoperations
Net cash used in operating activities of discontinued operations (0.2) (0.5) (2.1)
Net cash provided by investing activities of discontinued operations 3.4 0.3 2.8
Net cash provided by (used in) discontinued operations $ 3.2 $ (0.2) $ 0.7
Increase (decrease) in cash and cash equivalents 17.7 – (178.3)
Cashandcashequivalents–beginningofyear 70.5 70.5 248.8
Cashandcashequivalents–endofyear $ 88.2 $ 70.5 $ 70.5
Cash flows from changes in current assets and liabilities
Receivables, net (9.4) (6.1) (5.9)
Inventories 50.6 (103.0) (79.3)
Prepaid expenses and other current assets (11.7) (6.6) (5.0)
Accounts payable 10.8 (10.2) 5.5
Accrued payroll (9.3) (13.3) 5.3
Prepaid/accrued income taxes 22.5 (16.3) 4.7
Other accrued taxes 6.4 (3.9) 2.3
Unearned revenues 36.4 31.1 27.3
Other current liabilities (56.2) (63.1) 57.3
Change in current assets and liabilities $ 40.1 $ (191.4) $ 12.2
See accompanying notes to consolidated financial statements.
38 Darden Restaurants, Inc. 2013 Annual Report