Red Lobster 2013 Annual Report Download - page 24
Download and view the complete annual report
Please find page 24 of the 2013 Red Lobster annual report below. You can navigate through the pages in the report by either clicking on the pages listed below, or by using the keyword search tool below to find specific information within the annual report.-
 1
1 -
2
-
3
-
4
-
5
-
6
-
7
-
8
-
9
-
10
-
11
-
12
-
13
-
 14
14 -
 15
15 -
 16
16 -
 17
17 -
 18
18 -
 19
19 -
 20
20 -
 21
21 -
 22
22 -
 23
23 -
 24
24 -
 25
25 -
 26
26 -
 27
27 -
 28
28 -
 29
29 -
 30
30 -
 31
31 -
 32
32 -
 33
33 -
 34
34 -
35
-
36
-
37
-
38
-
39
-
40
-
41
-
42
-
43
-
44
-
45
-
46
-
47
-
48
-
49
-
50
-
51
-
52
-
53
-
54
-
55
-
56
-
57
-
58
-
59
-
60
-
61
-
62
-
63
-
64
-
65
-
66
-
67
-
68
-
69
-
70
-
71
-
72
-
73
-
74
 |
 |

Management’s Discussion and Analysis
of Financial Condition and Results of Operations
Darden
20 Darden Restaurants, Inc. 2013 Annual Report
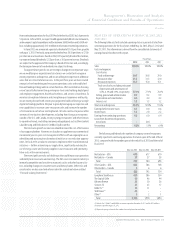
SALES
Sales from continuing operations were $8.55 billion in fiscal 2013, $8.00 billion
in fiscal 2012 and $7.50 billion in fiscal 2011. The 6.9 percent increase in sales
from continuing operations for fiscal 2013 was driven by the addition of 104 net
new company-owned restaurants plus the addition of 40 Yard House purchased
restaurants and a 2.1 percent blended same-restaurant sales increase for The
Capital Grille, Bahama Breeze and Seasons 52, partially offset by the 1.3 percent
blended same-restaurant sales decrease for Olive Garden, Red Lobster and
LongHorn Steakhouse.
Olive Garden’s sales of $3.68 billion in fiscal 2013 were 2.9 percent above
last fiscal year, driven primarily by revenue from 36 net new restaurants partially
offset by a U.S. same-restaurant sales decrease of 1.5 percent. The decrease in U.S.
same-restaurant sales resulted from a 2.8 percent decrease in same-restaurant
guest counts partially offset by a 1.3 percent increase in average check. Average
annual sales per restaurant for Olive Garden were $4.6 million in fiscal 2013
compared to $4.7 million in fiscal 2012.
Red Lobster’s sales of $2.62 billion in fiscal 2013 were 1.7 percent below last
fiscal year, driven primarily by a U.S. same-restaurant sales decrease of 2.2 percent
partially offset by revenue from one net new restaurant. The decrease in U.S.
same-restaurant sales resulted from a 1.8 percent decrease in same-restaurant
guest counts combined with a 0.4 percent decrease in average guest check.
Average annual sales per restaurant for Red Lobster were $3.7 million in fiscal
2013 compared to $3.8 million in fiscal 2012.
LongHorn Steakhouse’s sales of $1.23 billion in fiscal 2013 were 10.3 percent
above last fiscal year, driven primarily by revenue from 44 net new restaurants
combined with a same-restaurant sales increase of 1.2 percent. The increase in
same-restaurant sales resulted from a 1.1 percent increase in same-restaurant
guest counts combined with a 0.1 percent increase in average guest check.
Average annual sales per restaurant for LongHorn Steakhouse were $3.0 million
in fiscal 2013 and fiscal 2012.
In total, The Capital Grille, Bahama Breeze, Seasons 52, Eddie V’s and Yard
House generated sales of $986.4 million in fiscal 2013, which were 58.3 percent
above last fiscal year, primarily driven by the Yard House acquisition. Additionally,
Seasons 52 added 8 new restaurants, Yard House added 4 new restaurants, The
Capital Grille added 3 new restaurants, Bahama Breeze added 3 new restaurants,
and Eddie V’s added 1 new restaurant. Sales growth also reflected same-restaurant
sales increases of 3.3 percent at The Capital Grille, 1.2 percent at Seasons 52 and
0.2 percent at Bahama Breeze. Average annual sales per restaurant for The Capital
Grille were $7.0 million in fiscal 2013 compared to $6.8 million in fiscal 2012.
Average annual sales per restaurant for Bahama Breeze were $5.5 million in fiscal
2013 compared to $5.6 million in fiscal 2012. Average annual sales per restaurant
for Seasons 52 were $6.2 million in fiscal 2013 compared to $6.4 million in fiscal
2012. Average annual sales per restaurant for Eddie V’s were $5.8 million in fiscal
2013 compared to $5.9 million in fiscal 2012.
The 6.6 percent increase in sales from continuing operations for fiscal 2012
was driven by the addition of 89 net new company-owned restaurants plus the
addition of 11 Eddie V’s purchased restaurants, and the 1.8 percent blended same-
restaurant sales increase for Olive Garden, Red Lobster and LongHorn Steakhouse.
Olive Garden’s sales of $3.58 billion in fiscal 2012 were 2.5 percent above fiscal
2011, driven primarily by revenue from 38 net new restaurants partially offset
by a U.S. same-restaurant sales decrease of 1.2 percent. The decrease in U.S.
same-restaurant sales resulted from a 1.3 percent decrease in same-restaurant
guest counts partially offset by a 0.1 percent increase in average check. Average
annual sales per restaurant for Olive Garden were $4.7 million in fiscal 2012
compared to $4.8 million in fiscal 2011.
Red Lobster’s sales of $2.67 billion in fiscal 2012 were 5.9 percent above fiscal
2011, driven primarily by a U.S. same-restaurant sales increase of 4.6 percent
combined with revenue from six net new restaurants. The increase in U.S. same-
restaurant sales resulted from a 2.2 percent increase in same-restaurant guest
counts combined with a 2.4 percent increase in average guest check. Average
annual sales per restaurant for Red Lobster were $3.8 million in fiscal 2012
compared to $3.6 million in fiscal 2011.
LongHorn Steakhouse’s sales of $1.12 billion in fiscal 2012 were 13.5 percent
above fiscal 2011, driven primarily by revenue from 32 net new restaurants
combined with a same-restaurant sales increase of 5.3 percent. The increase in
same-restaurant sales resulted from a 4.8 percent increase in same-restaurant
guest counts combined with a 0.5 percent increase in average guest check. Average
annual sales per restaurant for LongHorn Steakhouse were $3.0 million in fiscal
2012 compared to $2.9 million in fiscal 2011.
In total, The Capital Grille, Bahama Breeze, Seasons 52 and Eddie V’s generated
sales of $623.0 million in fiscal 2012, which were 24.1 percent above fiscal 2011,
primarily driven by 2 net new restaurants at The Capital Grille, 4 new restaurants
at Bahama Breeze, 6 new restaurants at Seasons 52 and the addition of 11 Eddie V’s
purchased restaurants. Additionally, sales growth reflected same-restaurant
sales increases of 5.3 percent at The Capital Grille, 3.4 percent at Bahama Breeze
and 3.8 percent at Seasons 52. Average annual sales per restaurant for The Capital
Grille were $6.8 million in fiscal 2012 compared to $6.5 million in fiscal 2011.
Average annual sales per restaurant for Bahama Breeze were $5.6 million in fiscal
2012 compared to $5.5 million in fiscal 2011. Average annual sales per restaurant
for Seasons 52 were $6.4 million in fiscal 2012 compared to $6.3 million in fiscal 2011.
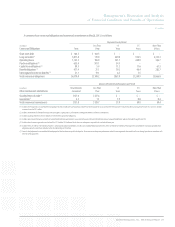
COSTS AND EXPENSES
Total costs and expenses from continuing operations were $8.03 billion in fiscal
2013, $7.36 billion in fiscal 2012 and $6.85 billion in fiscal 2011. As a percent of
sales, total costs and expenses from continuing operations were 93.9 percent in
fiscal 2013, 92.0 percent in fiscal 2012 and 91.4 percent in fiscal 2011.
Food and beverage costs increased $168.0 million, or 6.8 percent, from
$2.46 billion in fiscal 2012 to $2.63 billion in fiscal 2013. Food and beverage
costs increased $287.0 million, or 13.2 percent, from $2.17 billion in fiscal 2011
to $2.46 billion in fiscal 2012. As a percent of sales, food and beverage costs
decreased from fiscal 2012 to fiscal 2013 primarily as a result of pricing leverage
and lower seafood costs, partially offset by higher beef costs and unfavorable
menu-mix. As a percent of sales, food and beverage costs increased from fiscal
2011 to fiscal 2012 primarily as a result of higher seafood and other food com-
modity costs and unfavorable menu-mix, partially offset by pricing.
Restaurant labor costs increased $196.0 million, or 7.8 percent, from
$2.50 billion in fiscal 2012 to $2.70 billion in fiscal 2013. Restaurant labor costs
increased $105.1 million, or 4.4 percent, from $2.40 billion in fiscal 2011 to
$2.50 billion in fiscal 2012. As a percent of sales, restaurant labor costs increased
in fiscal 2013 primarily as a result of wage-rate inflation and lost sales leverage,
partially offset by lower manager incentive compensation. As a percent of sales,
restaurant labor costs decreased in fiscal 2012 primarily as a result of sales leveraging,