Red Lobster 2013 Annual Report Download - page 23
Download and view the complete annual report
Please find page 23 of the 2013 Red Lobster annual report below. You can navigate through the pages in the report by either clicking on the pages listed below, or by using the keyword search tool below to find specific information within the annual report.-
 1
1 -
2
-
3
-
4
-
5
-
6
-
7
-
8
-
9
-
10
-
11
-
12
-
 13
13 -
 14
14 -
 15
15 -
 16
16 -
 17
17 -
 18
18 -
 19
19 -
 20
20 -
 21
21 -
 22
22 -
 23
23 -
 24
24 -
 25
25 -
 26
26 -
 27
27 -
 28
28 -
 29
29 -
 30
30 -
 31
31 -
 32
32 -
 33
33 -
34
-
35
-
36
-
37
-
38
-
39
-
40
-
41
-
42
-
43
-
44
-
45
-
46
-
47
-
48
-
49
-
50
-
51
-
52
-
53
-
54
-
55
-
56
-
57
-
58
-
59
-
60
-
61
-
62
-
63
-
64
-
65
-
66
-
67
-
68
-
69
-
70
-
71
-
72
-
73
-
74
 |
 |

Management’s Discussion and Analysis
of Financial Condition and Results of Operations
Darden
Darden Restaurants, Inc. 2013 Annual Report 19
from continuing operations for fiscal 2014 to be below fiscal 2013 by 3.0 percent to
5.0 percent. In fiscal 2014, we expect to add approximately 80 net new restaurants,
and we expect capital expenditures will be between $600.0 million and $650.0 mil-
lion, including approximately $15.0 million in information technology initiatives.
In June 2013, we announced a quarterly dividend of $0.55 per share, payable
on August 1, 2013. Previously, our quarterly dividend was $0.50 per share, or $2.00
per share on an annual basis. Based on the $0.55 quarterly dividend declaration,
our expected annual dividend is $2.20 per share, a 10.0 percent increase. Dividends
are subject to the approval of the Company’s Board of Directors and, accordingly,
the timing and amount of our dividends are subject to change.
To support future growth, we are striving to change in two important ways:
we are modifying our organizational structure so we can better leverage our
existing experience and expertise, and we are adding new expertise in additional
areas that are critical to future success. In the past three years we have created
enterprise-level marketing and restaurant operations units and established
forward-looking strategy units in certain functions. We have initiatives focusing
on our Specialty Restaurant Group, enterprise-level sales building, digital guest
and employee engagement, health and wellness, and centers of excellence. To
maintain strong brand relevance and strengthen guest experience and loyalty,
we are moving forward with a multi-year program to build and leverage a single
digital technology platform. We plan to grow by leveraging our expertise and
new capabilities to increase same-restaurant sales and increase the number
of restaurants in each of our existing brands. We also continue to pursue other
avenues of new business development, including franchising our restaurants
outside of the U.S. and Canada, testing “synergy restaurants” and other formats
to expand our brands, and selling consumer packaged goods such as Olive Garden’s
salad dressing and Red Lobster’s Cheddar Bay Biscuit Mix.
The total sales growth we envision should increase the cost-effectiveness
of our support platform. However, we also plan to supplement our conventional
incremental year-to-year cost management efforts with an ongoing focus on
identifying and pursuing transformational multi-year cost reduction opportu-
nities. In fiscal 2014, we plan to continue to implement three transformational
initiatives–furtherautomatingoursupplychain,significantlyreducingthe
use of energy, water and cleaning supplies in our restaurants and optimizing
labor costs within our restaurants.
There are significant risks and challenges that could impact our operations
and ability to increase sales and earnings. The full-service restaurant industry is
intensely competitive and sensitive to economic cycles and other business fac-
tors, including changes in consumer tastes and dietary habits. Other risks and
uncertainties are discussed and referenced in the subsection below entitled
“Forward-Looking Statements.”
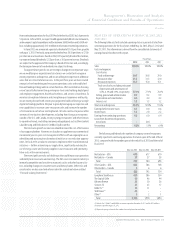
RESULTS OF OPERATIONS FOR FISCAL 2013, 2012
AND 2011
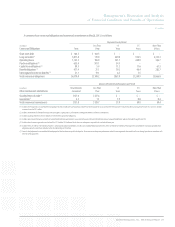
The following table sets forth selected operating data as a percent of sales from
continuing operations for the fiscal years ended May 26, 2013, May 27, 2012 and
May 29, 2011. This information is derived from the consolidated statements of
earnings found elsewhere in this report.
Fiscal Years
2013 2012 2011
Sales 100.0% 100.0% 100.0%
Costs and expenses:
Cost of sales:
Food and beverage 30.7 30.8 29.0
Restaurant labor 31.5 31.3 32.0
Restaurant expenses 15.7 15.0 15.1
Total cost of sales, excluding restaurant
depreciation and amortization of
4.4%, 4.1% and 3.9%, respectively 77.9% 77.1% 76.1%
Selling, general and administrative 9.9 9.2 9.9
Depreciation and amortization 4.6 4.4 4.2
Interest, net 1.5 1.3 1.2
Total costs and expenses 93.9% 92.0% 91.4%
Earnings before income taxes 6.1 8.0 8.6
Income taxes 1.3 2.0 2.2
Earnings from continuing operations 4.8 6.0 6.4
Losses from discontinued operations,
net of taxes – (0.1) –
Net earnings 4.8% 5.9% 6.4%
The following table details the number of company-owned restaurants
currently reported in continuing operations that were open at the end of fiscal
2013, compared with the number open at the end of fiscal 2012 and the end of
fiscal 2011.
May 26, 2013 May 27, 2012 May 29, 2011
RedLobster–USA 678 677 670
RedLobster–Canada 27 27 28
Total 705 704 698
OliveGarden–USA 822 786 748
OliveGarden–Canada 6 6 6
Total 828 792 754
LongHorn Steakhouse 430 386 354
The Capital Grille 49 46 44
Bahama Breeze 33 30 26
Seasons 52 31 23 17
Eddie V’s (1) 12 11 –
Yard House (1) 44 – –
Other (2) 6 2 1
Total 2,138 1,994 1,894
(1) Includes the 11 Eddie V’s and Wildfish restaurants acquired on November 14, 2011 and the 40 Yard House
restaurants acquired on August 29, 2012.
(2) Represents synergy restaurants that combine two existing brands in one building.