Red Lobster 2013 Annual Report Download - page 10
Download and view the complete annual report
Please find page 10 of the 2013 Red Lobster annual report below. You can navigate through the pages in the report by either clicking on the pages listed below, or by using the keyword search tool below to find specific information within the annual report.-
 1
1 -
 2
2 -
 3
3 -
 4
4 -
 5
5 -
 6
6 -
 7
7 -
 8
8 -
 9
9 -
 10
10 -
 11
11 -
 12
12 -
 13
13 -
 14
14 -
 15
15 -
 16
16 -
 17
17 -
 18
18 -
 19
19 -
 20
20 -
 21
21 -
22
-
23
-
24
-
25
-
26
-
27
-
28
-
29
-
30
-
31
-
32
-
33
-
34
-
35
-
36
-
37
-
38
-
39
-
40
-
41
-
42
-
43
-
44
-
45
-
46
-
47
-
48
-
49
-
50
-
51
-
52
-
53
-
54
-
55
-
56
-
57
-
58
-
59
-
60
-
61
-
62
-
63
-
64
-
65
-
66
-
67
-
68
-
69
-
70
-
71
-
72
-
73
-
74
 |
 |

the acquisition added $258 million in
sales in fiscal 2013.
• We continued to buy back Darden
common stock, spending $52 million
in fiscal 2013 to repurchase 1 million
shares, before postponing share repur-
chase in August 2012 because of the
acquisition of Yard House. Since our
share repurchase program began in
1995, we have repurchased nearly
172 million shares of our common
stock for $3.82 billion.
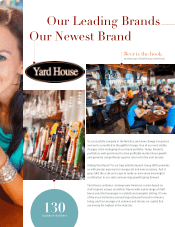
A Strong Foundation
As we look forward, we approach the
challenges ahead with a very strong
foundation. The most important founda-
tional strength is our brands, starting with
the three largest. Each has enduring and
broad consumer appeal, which shows in
their number of restaurants, average annual
sales per restaurant and restaurant-level
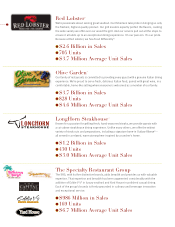
returns. With respect to average sales per
restaurant, Olive Garden and Red Lobster
have long been leaders on this important
measure, compared to other nationally
advertised casual dining chains. That
continues to be true, despite a difficult
fiscal 2013. At LongHorn Steakhouse,
average sales per restaurant are solid as
well, especially considering that the
amount the brand spends on television
advertising is a fraction of the amount spent
by most nationally advertised chains,
including Olive Garden and Red Lobster.
In addition, within our Specialty Restau-
rant Group, each brand’s average sales
per restaurant is among the highest in the
restaurant industry, regardless of industry
segment. Importantly, all our brands are able
to translate competitively strong average
sales per restaurant into competitively
superior restaurant-level returns.
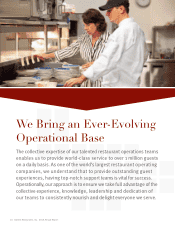
In addition to strong brands, we have a
cost-effective operating support platform.
It is the product of considerable collective
expertise and experience in areas that are
critical to success in our business, including
brand management, restaurant operations,
supply chain, talent management and
information technology. With appealing
brands that have strong restaurant-level
returns and are supported by a cost-
effective operating platform, we have a
competitively superior operating profit
margin compared to other major chain
restaurant operators with comparable,
primarily company-owned business
models. The net result is that we have
substantial and durable operating cash
flow. Our operating cash flow has nearly
doubled over the past 10 years, growing
to $950 million in fiscal 2013 – or $515,000
in pre-tax cash per restaurant – despite
our setbacks during the year. Together,
these strengths provide us with a strong
foundation as we respond to the important
consumer and competitive reali ties that,
we believe, amount to a New Era.
Operating in a New Era
Key Consumer And Competitive Dynamics
The consumer and competitive dynamics
driving the need for change have been a
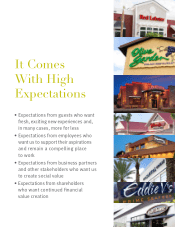
reality for several years. One important
dynamic is that many guests are finan-
cially constrained. For some, this is a
matter of life stage. These are guests
who are more budget conscious because
they are young and just entering the
workplace or, at the other end of the
spectrum, because they have recently
retired and are beginning to live on fixed
incomes. For other guests, financial
constraint is due to macroeconomic
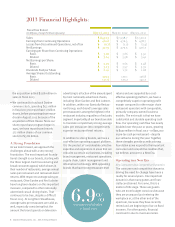
Fiscal Year Ended
(In Millions, Except Per Share Amounts) May 26, 2013 May 27, 2012 May 29, 2011
Sales $ 8,551.9 $ 7,998.7 $ 7,500.2
Earnings from Continuing Operations $ 412.6 $ 476.5 $ 478.7
Losses from Discontinued Operations, net of tax $ (0.7) $ (1.0) $ (2.4)
Net Earnings $ 411.9 $ 475.5 $ 476.3
Earnings per Share from Continuing Operations:
Basic $ 3.20 $ 3.66 $ 3.50
Diluted $ 3.14 $ 3.58 $ 3.41
Net Earnings per Share:
Basic $ 3.19 $ 3.65 $ 3.48
Diluted $ 3.13 $ 3.57 $ 3.39
Dividends Paid per Share $ 2.00 $ 1.72 $ 1.28
Average Shares Outstanding:
Basic 129.0 130.1 136.8
Diluted 131.6 133.2 140.3
2013 Financial Highlights:
6.9%
increase in total sales
in fiscal 2013
6 Darden Restaurants, Inc. 2013 Annual Report