Red Lobster 2013 Annual Report Download - page 58
Download and view the complete annual report
Please find page 58 of the 2013 Red Lobster annual report below. You can navigate through the pages in the report by either clicking on the pages listed below, or by using the keyword search tool below to find specific information within the annual report.-
 1
1 -
2
-
3
-
4
-
5
-
6
-
7
-
8
-
9
-
10
-
11
-
12
-
13
-
14
-
15
-
16
-
17
-
18
-
19
-
20
-
21
-
22
-
23
-
24
-
25
-
26
-
27
-
28
-
29
-
30
-
31
-
32
-
33
-
34
-
35
-
36
-
37
-
38
-
39
-
40
-
41
-
42
-
43
-
44
-
45
-
46
-
47
-
 48
48 -
 49
49 -
 50
50 -
 51
51 -
 52
52 -
 53
53 -
 54
54 -
 55
55 -
 56
56 -
 57
57 -
 58
58 -
 59
59 -
 60
60 -
 61
61 -
 62
62 -
 63
63 -
 64
64 -
 65
65 -
 66
66 -
 67
67 -
 68
68 -
69
-
70
-
71
-
72
-
73
-
74
 |
 |

Notes to Consolidated Financial Statements
Darden
54 Darden Restaurants, Inc. 2013 Annual Report
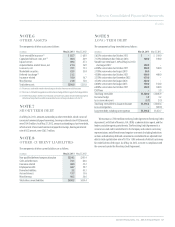
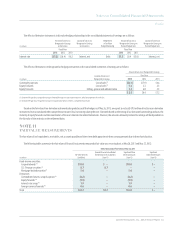
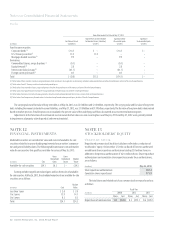
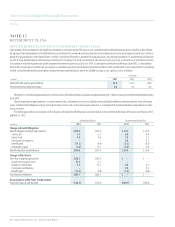
NOTE 14
LEASES
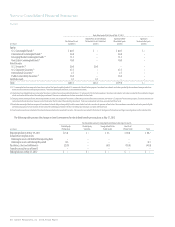
An analysis of rent expense incurred related to restaurants in continuing
operations is as follows:
Fiscal Year
(in millions)
2013 2012 2011
Restaurant minimum rent $157.7 $130.9 $120.6
Restaurant percentage rent 6.6 5.6 5.3
Restaurant rent averaging expense 16.6 12.9 11.1
Transportation equipment 3.8 3.5 3.2
Office equipment 0.9 0.6 0.4
Office space 1.5 1.0 0.9
Warehouse space 0.4 0.6 0.5
Total rent expense $187.5 $155.1 $142.0
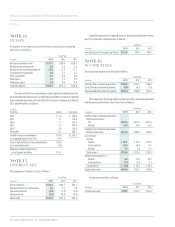
The annual future lease commitments under capital lease obligations and
noncancelable operating leases, including those related to restaurants reported
as discontinued operations, for each of the five fiscal years subsequent to May 26,
2013 and thereafter is as follows:
(in millions)
Fiscal Year Capital Operating
2014 $ 5.4 $ 186.0
2015 5.5 178.6
2016 5.7 163.1
2017 5.7 144.4
2018 5.9 124.5
Thereafter 61.3 366.7
Total future lease commitments $ 89.5 $1,163.3
Less imputed interest (at 6.5%) (35.1)
Present value of future lease commitments $ 54.4
Less current maturities (1.9)
Obligations under capital leases,
net of current maturities $ 52.5
NOTE 15
INTEREST, NET
The components of interest, net are as follows:
Fiscal Year
(in millions)
2013 2012 2011
Interest expense $126.2 $102.7 $93.7
Imputed interest on capital leases 3.6 3.7 3.8
Capitalized interest (3.0) (3.9) (3.0)
Interest income (0.9) (0.9) (0.9)
Interest, net $125.9 $101.6 $93.6
Capitalized interest was computed using our average borrowing rate. Interest
paid, net of amounts capitalized was as follows:
Fiscal Year
(in millions)
2013 2012 2011
Interest paid, net of amounts capitalized $112.5 $94.8 $98.3
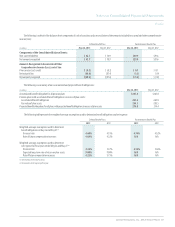
NOTE 16
INCOME TAXES
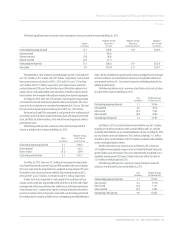
Total income tax expense was allocated as follows:
Fiscal Year
(in millions)
2013 2012 2011
Earnings from continuing operations $109.8 $161.5 $168.9
Losses from discontinued operations (0.4) (0.7) (1.5)
Total consolidated income tax expense $109.4 $160.8 $167.4
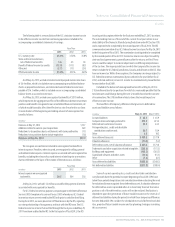
The components of earnings before income taxes from continuing operations
and the provision for income taxes thereon are as follows:
Fiscal Year
(in millions)
2013 2012 2011
Earnings from continuing operations
before income taxes:
U.S. $509.4 $621.4 $631.4
Foreign 13.0 16.6 16.2
Earnings from continuing operations
before income taxes $522.4 $638.0 $647.6
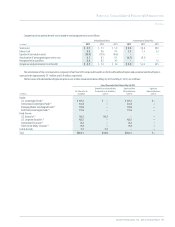
Income taxes:
Current:
Federal $ 86.7 $ 97.0 $121.9
State and local 20.4 26.0 17.5
Foreign 3.5 2.4 0.1
Total current $110.6 $125.4 $139.5
Deferred (principally U.S.):
Federal 6.9 37.6 28.3
State and local (7.7) (1.5) 1.1
Total deferred $ (0.8) $ 36.1 $ 29.4
Total income taxes $109.8 $161.5 $168.9
Income taxes paid were as follows:
Fiscal Year
(in millions)
2013 2012 2011
Income taxes paid $98.5 $123.5 $126.4